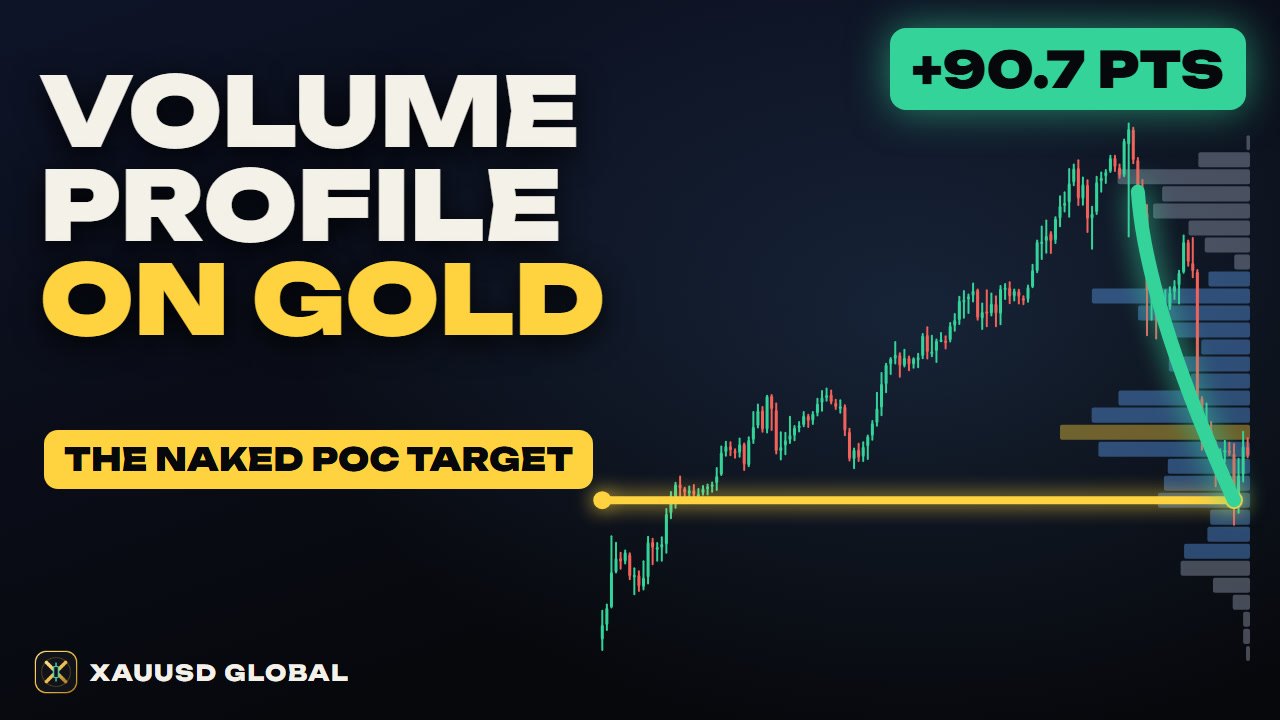
Trading Maths for Gold: Why a 70% Win Rate Can Still Lose
Why can a 70% win rate still lose money? This advanced lesson explains trading maths for gold (XAUUSD) in simple words: R, the risk unit, on a real gold chart (stop in points, lot size, dollars at risk); reward to risk; why win rate means nothing on its own; expectancy = (hit rate x average win) - (miss rate x average loss), with two made-up example systems; the break-even win rate table; costs measured in R; the classic trap of a tiny target with a huge stop, run on real gold prices; why losing streaks are normal (a seeded simulation of 1,000 random sequences); drawdown and the recovery maths (lose 50%, need +100%); fixed percent position sizing and the risk of ruin idea; and the pro habits of tracking R and reviewing in batches of 30 to 50 trades.
Chapters
- 0:00A gold rule that won 348 times and still lost
- 0:39R, the risk unit (stop, lot size, dollars at risk)
- 2:02Why win rate means nothing on its own (expectancy)
- 3:06The break-even win rate table
- 3:48Costs measured in R
- 4:31The classic trap: tiny target, huge stop (real gold)
- 5:58Losing streaks are normal (simulation)
- 6:51Drawdown and the recovery maths
- 7:30Position size and the risk of ruin
- 8:46Pro habits: track R, review in batches
- 9:17Does your system have an edge? (flowchart)
- 9:50Recap
Key points
R is your risk unit: the distance to your stop times your lot size, in dollars. Measure every trade in R.
Win rate means nothing on its own: expectancy = (hit rate x average win) - (miss rate x average loss). A made-up 70% system with 0.3R wins loses money; a 30% system with 3R wins makes money.
Break-even hit rate = 1 / (1 + reward:risk): 50% at 1:1, 33.3% at 1:2, 25% at 1:3. Costs in R raise that bar.
Losing streaks and drawdowns are normal; a 50% drawdown needs a 100% gain to recover, so keep risk per trade small.
Track R on every trade and review in batches; maths shows whether a system has an edge, it never guarantees future results.
Chart data: COMEX gold futures OHLC from Yahoo Finance (GC=F), times in UTC. Education only, not a signal.
Read more: Trading Math for Gold Traders: R-Multiples, Expectancy, Drawdowns and Position Sizing · XAUUSD Risk Management and Position Sizing · Expectancy · Win rate · Risk reward ratio · Drawdown · Position sizing
Transcript
We tested a simple gold rule on real prices. It hit its target 348 times, and it was stopped out only 62 times. That sounds like a great strategy. But each win made 10 points, and each loss cost 60. After costs, it ended down 363 points. A high win rate means nothing on its own. One bad day can wipe out a week of wins. This is the lesson on trading maths. You'll learn R, reward to risk, expectancy, break-even win rates, costs, losing streaks, drawdowns and position size, with simple numbers and real gold charts.
Chapter one. R, the risk unit. R is the amount you risk on one trade: the distance from your entry to your stop. Then every result is measured in R. Risk 100 dollars and make 200: that's plus 2R. Lose the 100: that's minus 1R. Here's a real gold buy, on 3 March 2025. Price made a swing low. We buy at 2,901.5, with the stop 2 points under the low, at 2,885.8. So 1R is 15.7 points. Now the lot size. Say the account is 10,000 dollars, and we risk 1%: 100 dollars. One lot is 100 ounces, so each point is worth 100 dollars per lot. 100 dollars, divided by 15.7 points times 100, is 0.064 lots. Always round down: 0.06 lots. Now each point is worth 6 dollars, and the real risk is $94.20. The target is 2R, 31.4 points away. Reward to risk compares what you aim to make with what you risk. Here, it's 1:2. The next day, it was hit: plus 2R, or $188.40. In R, you can compare this trade with any other, at any account size.
Chapter two. Why win rate means nothing on its own. Win rate, or hit rate, is how often you win. But it says nothing about how much you win, or how much you lose. Here are two made-up example systems. System A wins 70% of the time, but its average win is only 0.3R. System B wins just 30%, but its average win is 3R. Both lose 1R when they're wrong. Take 100 trades. System A: 70 wins at 0.3R make 21R. 30 losses cost 30R. Total: minus 9R. System B: 30 wins at 3R make 90R. 70 losses cost 70R. Total: plus 20R. That's expectancy, the average R per trade: hit rate times average win, minus miss rate times average loss. A: minus 0.09R per trade. B: plus 0.20R. The system that wins more often loses money.
Chapter three. The break-even win rate. For every reward to risk, there's one hit rate where you neither make nor lose money. It's 1, divided by 1 plus the reward to risk. At 1:1, you need 50%. At 1:2, 33.3%. At 1:3, just 25%. But at 1:0.5, you need 66.7%. And at 1:0.3, 76.9%. So System A's 70% is 6.9 points short of its break-even. System B's 30% is 5 points above it. Never judge a win rate without its reward to risk.
Chapter four. Costs, measured in R. Every trade pays the spread, and often a commission. Say 0.30 per ounce. What that costs in R depends on your stop. On our 15.7 point stop, it's only 0.02R. On a 5-point scalping stop, it's 0.06R on every trade. That's 6R every 100 trades. Now put System A on 5-point stops. Its target is only 1.5 points away, so the cost eats 20% of every win. Expectancy falls to minus 0.15R. System B still makes plus 0.14R. Tiny targets suffer most.
Chapter five. The classic trap, on real gold. Here's the rule from the start. Every weekday, buy at the 07:00 UTC open. Target: 10 points. Stop: 60 points. The stop is six times the target, so it must win 85.7% of the time just to break even. With 0.30 of costs, each win is 9.7 points, each loss 60.3, and the break-even rises to 86.1%. On 21 April 2025, it bought at 3,403.5. By 11:00 UTC, the 10 points were there. Easy money. It won 7 days in a row like this. On 22 April, it bought at 3,489.7, just under a record high. Then gold turned. By 13:00 UTC, the stop was hit. Those 7 wins made 67.9 points. One loss took back 60.3 of them. Here's the whole test, from January 2025. 348 wins and 62 stops. The running total climbed for 14 months, to plus 595.3 points. Then the stops came close together. It ended at minus 363. One loss costs more than 6 wins. It even won 27 times in a row once. That's how this trap feels: safe, until it isn't.
Chapter six. Losing streaks are normal. Even a good system loses many times in a row. To see how often, we ran a simulation: 1,000 random sequences of 100 trades, with a fixed seed, so anyone can repeat it. With a 70% hit rate, the longest losing streak was usually 3. With 50%, usually 6. With 30%, usually 10, and 1 sequence in 20 had 17 or more. Here's System B, with its plus 0.20R edge, in 1,000 more sequences. These five run from the best to the worst. Same rules, same odds. The best made plus 76R. The worst lost 36R. 124 of the 1,000 ended below zero. The typical worst drawdown was 13R, and 1 in 20 fell 25R or more.
Chapter seven. Drawdown, and the recovery maths. A drawdown is how far your account falls from its last high. Getting back is harder than falling, because you're growing a smaller balance. Lose 10%, and you need 11.1% to get back. Lose 20%, you need 25%. Lose 30%, you need 42.9%. Lose half, and you need plus 100%. Lose 75%, and you need 300%. Small drawdowns are easy to fix. Big ones are very hard to undo. That's why the size of each trade matters so much.
Chapter eight. Position size, and the risk of ruin. Fixed percent risk means risking the same small share of your account on every trade. The size comes from the stop, like in chapter one. After losses, the size shrinks by itself. Ten losses in a row at 1% risk take the account down 9.6%. At 5% risk, the same streak takes it down 40.1%, and you'd need 67% just to get back. Risk of ruin is the chance of losing so much that you can't go on. We ran System B's same 1,000 sequences at different risk sizes, and counted how many ever fell to half the starting balance. At 1% risk: none. At 2%: 4. At 5%: 208. At 10%: 567, more than half. Same edge, same trades, only the size changed. Bigger risk never adds edge. It only adds pain. Look at 5% and 10%: the typical result was plus 82.6% at 5%, but only plus 64.2% at 10%. And with a negative edge like System A, no size can save you. Smaller size only loses more slowly.
Chapter nine. Pro habits. Track every trade in R, not dollars. Write down 1R before you enter, and the result in R after, with costs. Judge your numbers in batches of 30 to 50 trades: hit rate, average win, average loss and expectancy. A few trades tell you almost nothing. Watch your average loss. If it drifts past minus 1R, you're moving stops or trading into news. And never raise your risk because a few trades went well.
Chapter ten. Does your system have an edge? Do you know your average win and average loss in R? If not, log every trade first. Is the expectancy positive after costs? If not, fix the system, not the size. Is it based on at least 30 trades? If not, keep collecting. Can you survive the losing streaks your hit rate brings, at your risk per trade? If not, lower the risk. If yes, keep your risk small and fixed, and review every 30 to 50 trades.
Let's recap. Measure every trade in R, and size it from the stop, with a small fixed percent risk. Win rate means nothing alone. Expectancy is hit rate times average win, minus miss rate times average loss, after costs. Know your break-even win rate, and beware tiny targets with huge stops. Expect losing streaks and drawdowns. And remember: lose half, and you need double. The full written guide is on xauusdglobal.com. Subscribe for the next lesson, and come trade with us in the XAUUSD Global community. It's free during early access.
Other short videos
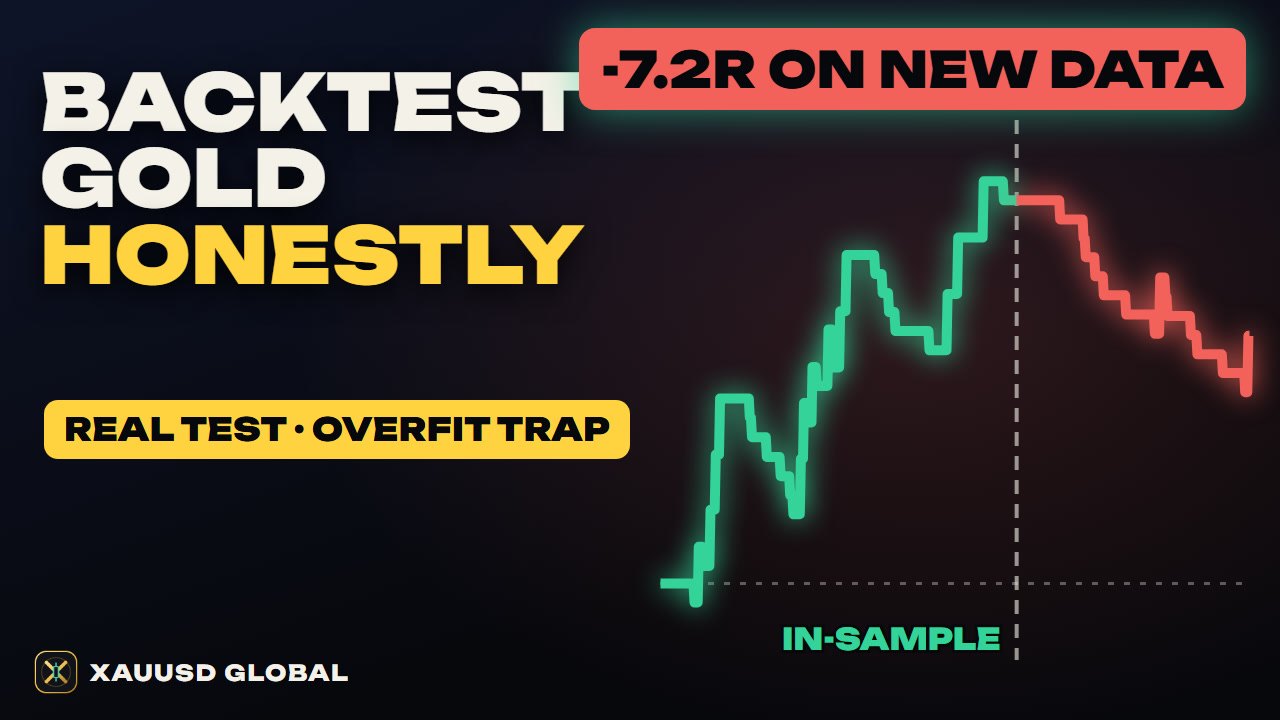
How to Backtest a Gold Strategy Honestly (XAUUSD, Real Test)
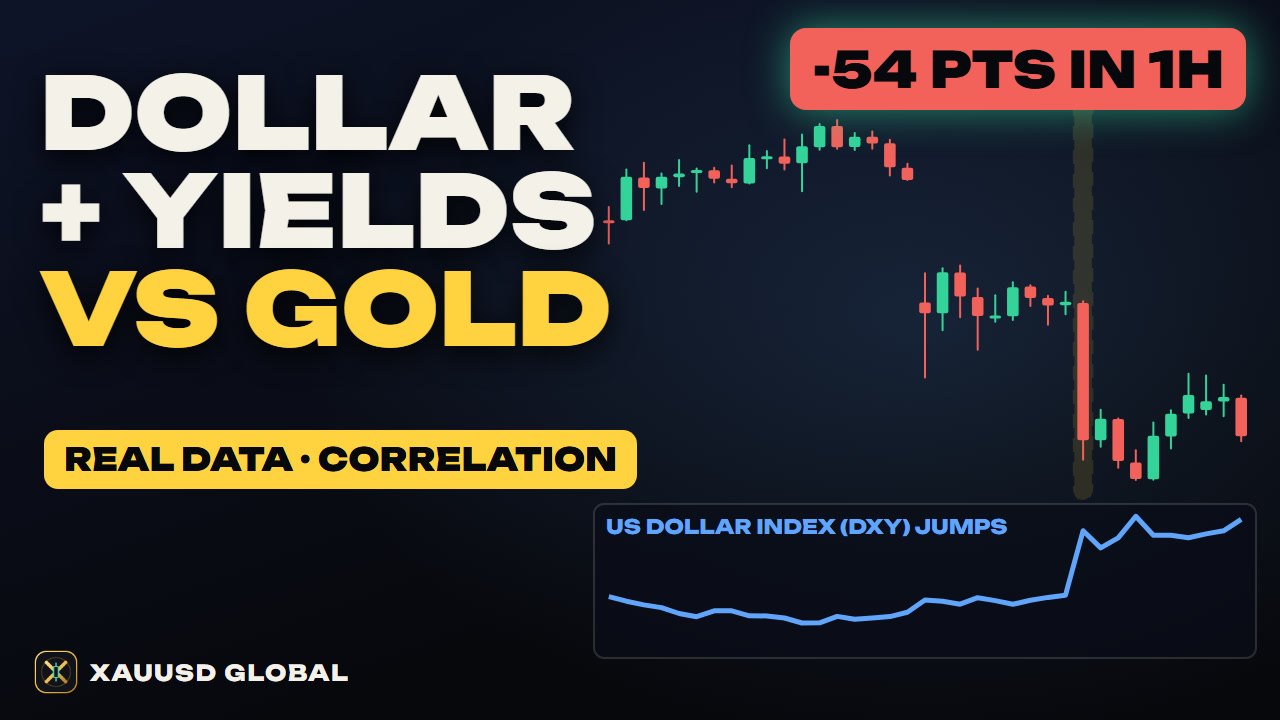
Dollar and Yields: What Really Moves Gold (DXY, Real Yields, XAUUSD)
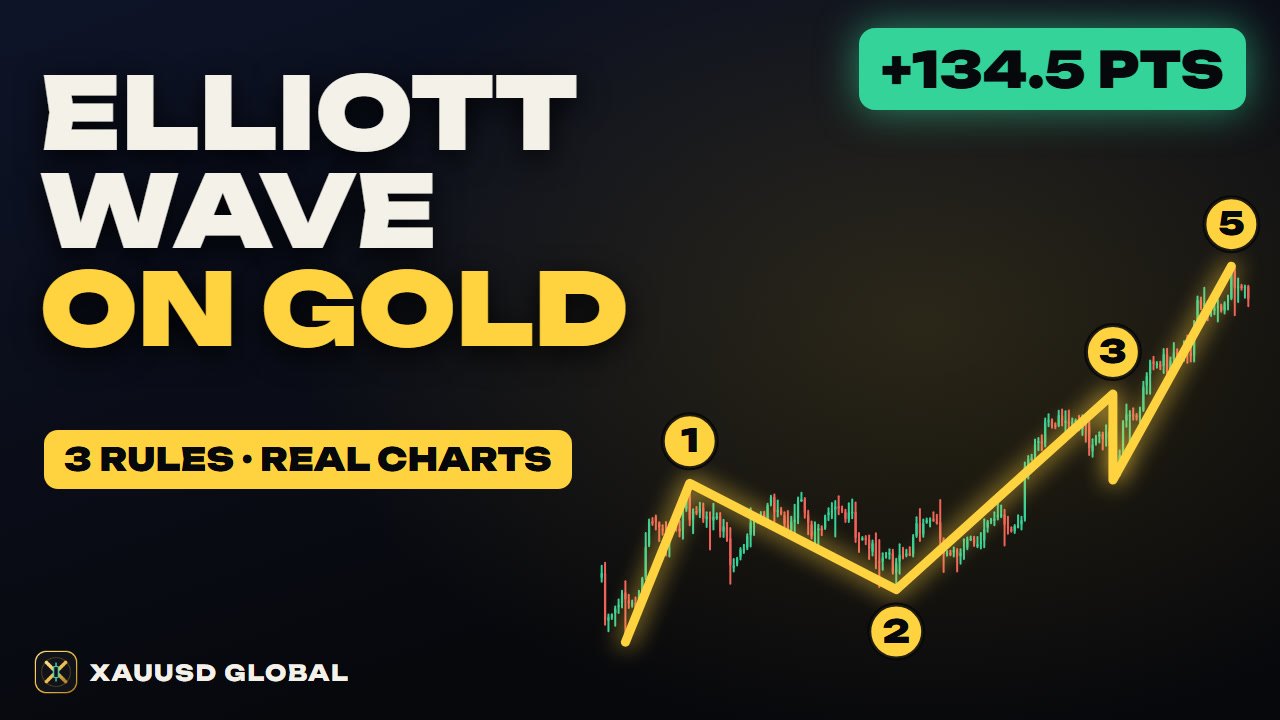
Elliott Wave on Gold: 3 Rules, Fibonacci Targets, Real XAUUSD Trades