Premium, Discount and OTE on Gold (XAUUSD): The Optimal Trade Entry
Premium, discount and the optimal trade entry (OTE) on gold (XAUUSD), from zero to the pro level, taught on real gold charts. You will learn which swing to measure for a dealing range (the move that broke structure, high to low or low to high, on a timeframe chosen first), equilibrium (the 50% level), premium and discount and why buying cheap and selling expensive improves your risk, the Fibonacci levels of the OTE band (0.62, 0.705 and 0.79, and how they relate to 0.618 and 0.786), entering with an order block or fair value gap inside the band, why the structure break matters and the lower-timeframe trigger pros add, stops beyond the swing, targets at the swing extreme and the -0.27 and -0.62 extensions, nesting the daily, 4-hour and 1-hour ranges, and how pros grade an OTE trade. Two real winners are walked through, and a real failure: an OTE sell that ran straight through the band and the 100% level.
Chapters
- 0:00A real gold OTE trade, start to finish
- 0:50The dealing range: which swing to measure
- 1:40Equilibrium, premium and discount
- 2:28The OTE levels: 0.62, 0.705, 0.79
- 3:45An order block or FVG inside the band
- 4:50Why the structure break matters
- 5:27Stops and targets, -0.27 and -0.62 extensions
- 6:32Daily, 4H and 1H ranges together
- 7:16When it fails: through OTE and the 100% level
- 8:13Pro level: grading and testing
- 9:16Should I take this trade? (flowchart)
- 9:54Recap
Key points
Measure the dealing range on the swing that broke structure, from its high to its low (or low to high), on the timeframe you chose first.
The 50% line is equilibrium: above it is premium (sell zone), below it is discount (buy zone).
The OTE band runs from about 0.62 to 0.79 of the swing; an order block or fair value gap inside the band is the entry zone.
Stops go beyond the swing; targets are the swing extreme, then the -0.27 and -0.62 extensions if price keeps going.
Nest the ranges: a 4-hour OTE sell that sits in deep daily discount is fighting the bigger picture and fails more easily.
Chart data: COMEX gold futures OHLC from Yahoo Finance (GC=F), times in UTC. Education only, not a signal.
Read more: Premium, Discount and Optimal Trade Entry (OTE) on Gold: Dealing Ranges and PD Arrays for XAUUSD · Premium discount · Ote · Dealing range · Fibonacci retracement · Fibonacci extension
Transcript
Gold, one hour chart, 13 November 2025. A fast drop broke structure and left one clean swing, from this high to this low. We measured that swing. The next day, price climbed back into the expensive half, right into a fair value gap inside the OTE band. That's the sell, with the stop above the swing high. Nine hours later, the swing low broke and the target was hit. 62.9 points, for 41.6 points of risk. Then gold kept falling, through both extension targets. This is premium, discount and the optimal trade entry. You'll learn which swing to measure, equilibrium, the OTE levels, zones inside the band, structure breaks, stops, targets and timeframes. Plus a trade that ran straight through all of it.
Chapter one. The dealing range. Everything starts with one swing. We call it the dealing range: the space between a swing high and a swing low. But which swing? Not a random one. Pick the move that broke structure: a strong push that closed beyond the last swing. Here, the one hour chart had been making higher lows. Then one candle closed below the last higher low: a change of character. Four hours later, a break of structure down. That whole drop is our range. For a drop, measure from the swing high down to the swing low. For a rally, from the low up to the high. Use the wicks, and decide your timeframe first. Ours is the four hour chart, where this drop is one clean swing. Then leave it alone. Redraw only when price breaks one end of the range.
Chapter two. Equilibrium, premium and discount. Cut the range in half. The middle line is equilibrium, the 50% level. Above equilibrium is premium: price is expensive. Below it is discount: price is cheap. Think of a shop. You want to buy when things are on sale, and sell when prices are high. So buy in discount, and sell in premium. It also fixes your risk. A sell in premium sits close to the swing high, where the stop goes. So the stop is short, and the target is far. A sell in discount is the opposite: a long stop, and a short target. On our drop, a sell low in the discount half would have risked about three times what it could make. Same chart, same idea, much worse trade.
Chapter three. The optimal trade entry. Inside premium and discount there is a smaller band: the optimal trade entry, or OTE. It runs from the 0.62 level to the 0.79 level of the swing. What do those numbers mean? 0.62 means price has come back 62% of the swing. A bit more than half. 0.79 means 79%, a deep pullback. And 0.705 is the middle of the band. To draw them, use the Fibonacci tool. For a sell, drag it from the swing high down to the swing low. For a buy, from the low up to the high. The start of the move is 1, the end is zero. Then add 0.5, 0.62, 0.705 and 0.79 to the tool's levels. You may see 0.618 and 0.786 on other charts. Those are the classic Fibonacci numbers. 0.62 and 0.79 are the same levels, rounded. On our drop, the band sat high in the premium half, but still below the swing high. One honest point. These levels are not magic. Price doesn't know where 0.705 is. The band only gives you a good price if a reaction comes. You still need a reason to enter.
Chapter four. A zone inside the band. That reason is a zone: an order block or a fair value gap, left by the move, sitting inside the OTE band. On our drop, the candle that broke structure left a fair value gap. And look where it sat: right inside the band. Good location, and a zone, in the same place. So the plan was simple. A sell limit where the gap meets the 0.62 level. If price came back, the order would fill at a premium price. Where exactly inside the zone? The near edge fills more often. A deeper entry, at 0.705 or lower, pays more, but fills less often. Pick one rule and keep it. Buys are the mirror. Gold, four hour range, from 29 April to 30 April 2026. On the one hour chart, an order block, with a fair value gap right on top of it, both inside the discount OTE. On 1 May, price dipped into the gap, and held. The buy reached its target, the swing high, the same day.
Chapter five. Why the structure break matters. A range only counts if the move that made it broke structure. That's the sign real buying or selling pushed price, not just noise. No break, no range. A swing inside a quiet, sideways market breaks nothing, and its OTE means nothing. Pros look for a second break, on a smaller chart. Price reaches the band, and the one hour or 15 minute chart turns back in their direction. Then they enter. And if the small chart breaks the other way, against them, they treat it as a warning. You'll see that warning in chapter eight.
Chapter six. Stops and targets. The stop goes beyond the swing: past the 100% level, plus a small buffer. If price breaks the swing that made the range, the range is dead. Our sell: entry at the 0.62 level, stop 3 points above the swing high. 41.6 points of risk. First target: the swing low, the zero level. Sell stops often wait just beyond it. On 14 November, nine hours after the fill, it broke. 62.9 points. Extensions are targets beyond the swing. Minus 0.27 means 27% of the range past the low. Minus 0.62 means 62% past it. Within two hours, gold reached both. But extensions don't always come. The April buy hit its swing high and never reached the first extension. Three days later, gold fell through the range low, and an open trade would have been stopped. So take the swing extreme first. Let extensions be a bonus, with your stop already moved.
Chapter seven. Timeframes working together. Every timeframe has its own range. Price can be in premium on the four hour chart, and in discount on the daily, at the same time. So pros stack them. The daily range for the bias. The four hour range for the setup. The one hour chart for the zone and the entry. Our November sell. The daily range ran from the 20 October high to the 28 October low. Our entry sat in its premium half. Daily premium, four hour premium: both said sell. When they disagree, the bigger range wins. A four hour sell that sits in daily discount is selling cheap. That's exactly what the next chapter shows.
Chapter eight. When it fails. 29 April 2026. A four hour drop broke structure. On the one hour chart, a gap and an order block reached into the premium OTE. Price came back, and the sell limit at 0.62 filled. Stop above the swing high. It looked like our November trade. It wasn't. On 30 April, price ran straight through the OTE band, through the 100% level, and hit the stop. What went wrong? Zoom out. On the daily chart, gold had already fallen from the 17 April high. This sell sat in deep daily discount. Selling cheap. And the one hour chart changed character up two hours before the stop. That was the warning to get out early. The rally that broke the stop made a new range, up. Its OTE buy was our April winner. When a range breaks, the old idea is dead. Draw the new one.
Chapter nine. The pro level. Pros grade every OTE trade. Did the move that made the range break structure? Is the entry in the right half of the daily range too? Is there a zone inside the band? Is the stop beyond the swing, with room to the target? All yes: an A trade, normal size. One weak point: a B, half size. More than one: skip it. Pros also accept that strong trends often never reach discount. Missing those moves is fine. Forcing a bad entry is not. And they write every range in their journal: the timeframe, the high, the low, wick or body. And they test. We ran the simple version on two years of gold data: a four hour range, a one hour zone inside the band, a limit at the zone, stop beyond the swing, target the swing extreme. It was stopped more often than it reached the target. Location alone is not an edge. So log every trade with its grade, and trade it live only if your own results say so.
Chapter ten. Should you take this trade? Any no, and you skip it. Did the move that made the range break structure? If not, skip. Is price in the right half: discount for a buy, premium for a sell, on the daily too? If not, wait. Is there an order block or a fair value gap inside the OTE band? If not, skip. Has the 100% level held? If price broke it, the range is dead. Draw a new one. Is the stop beyond the swing, with room to the target? Then write down entry, stop and target, and only then place the order.
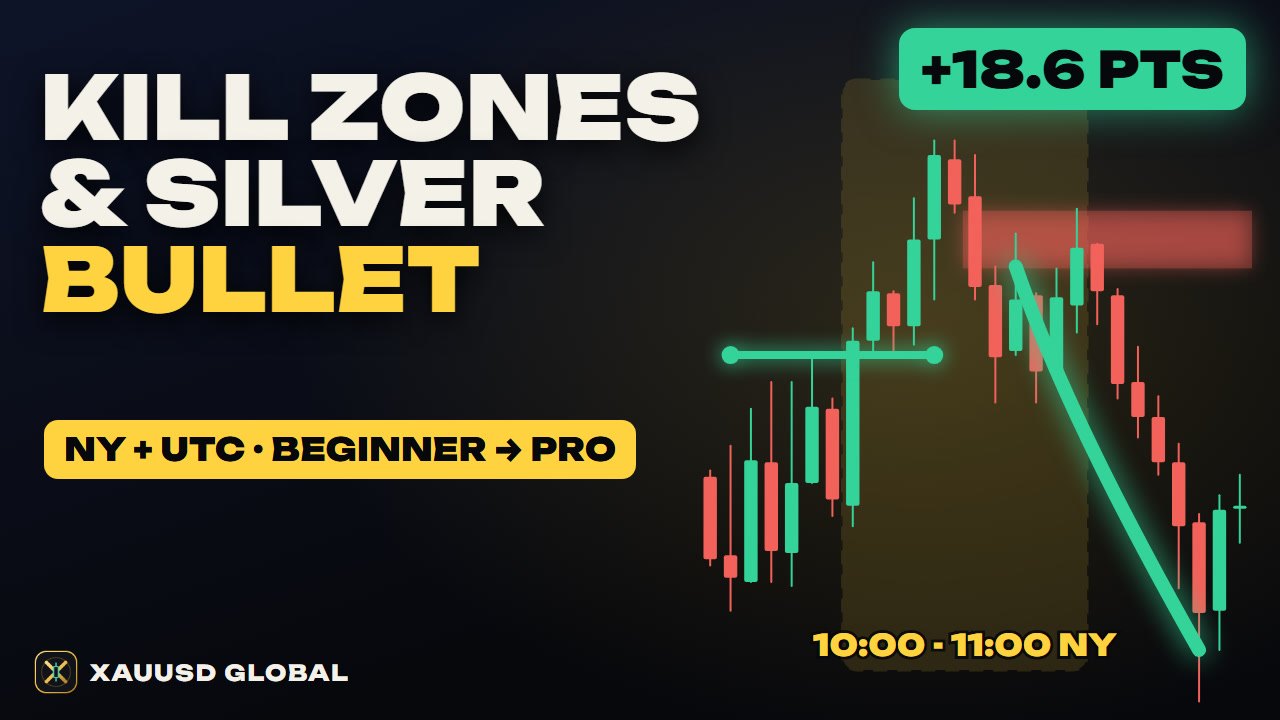
Let's recap. Measure the move that broke structure, from one end to the other, on a timeframe you chose first. The middle is equilibrium. Buy in discount, sell in premium. The OTE band, from 0.62 to 0.79, is a good price, not a signal. Want a zone inside the band, a stop beyond the swing, and the swing extreme as your first target. Check the bigger range, and when a range breaks, draw a new one. Next lesson: kill zones and the silver bullet. The full written guide is on xauusdglobal.com. Subscribe so you don't miss it, and come trade with us in the XAUUSD Global community. It's free during early access.
Other short videos
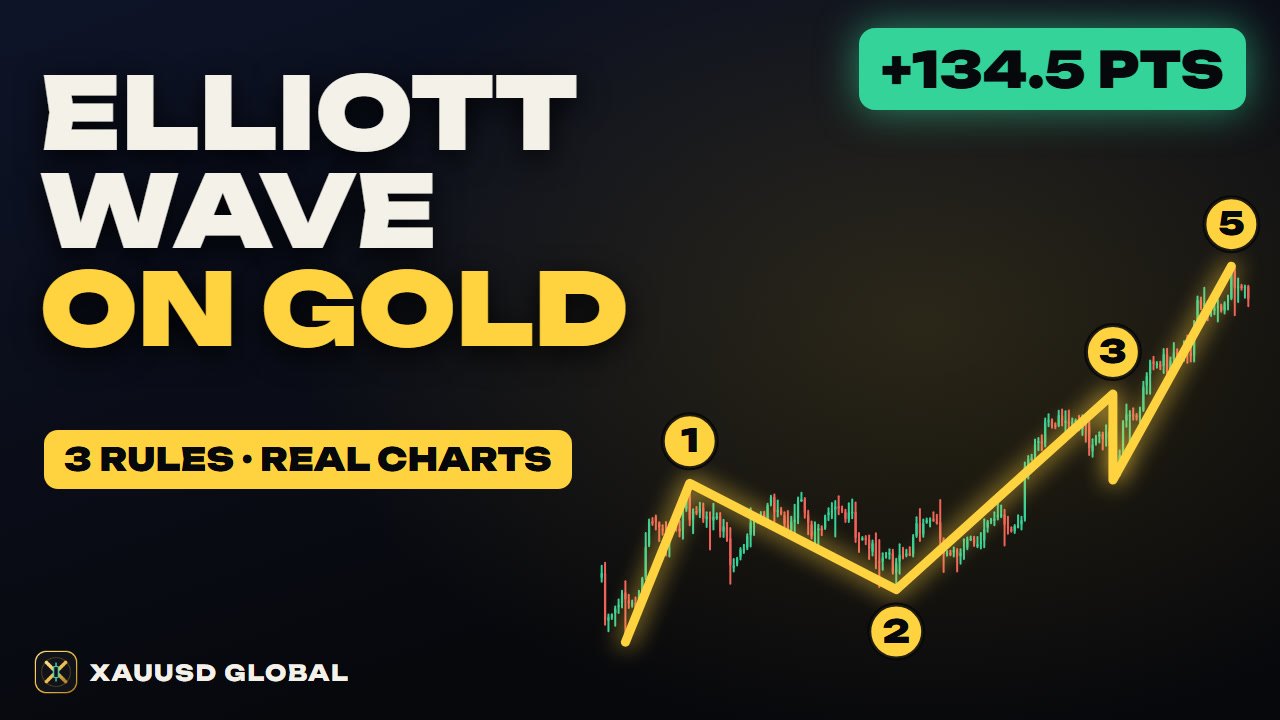
Elliott Wave on Gold: 3 Rules, Fibonacci Targets, Real XAUUSD Trades
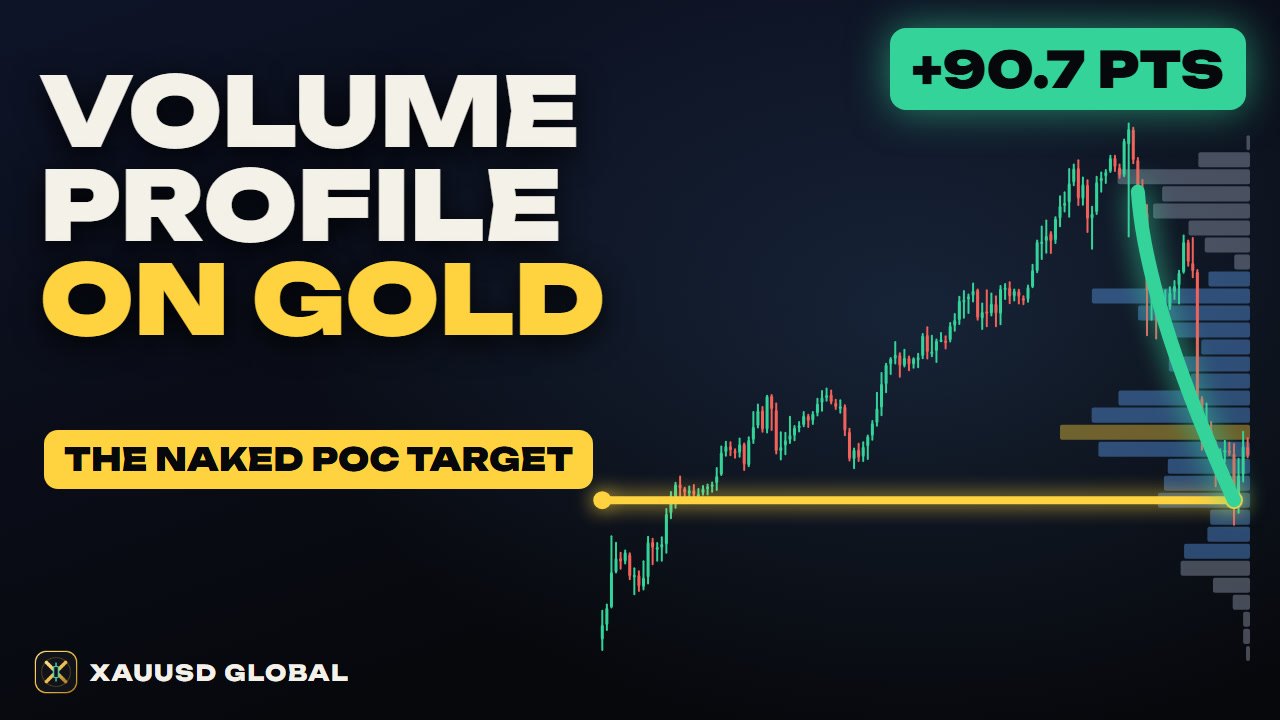
Volume Profile on Gold: POC, Value Area, HVN/LVN, Naked POC
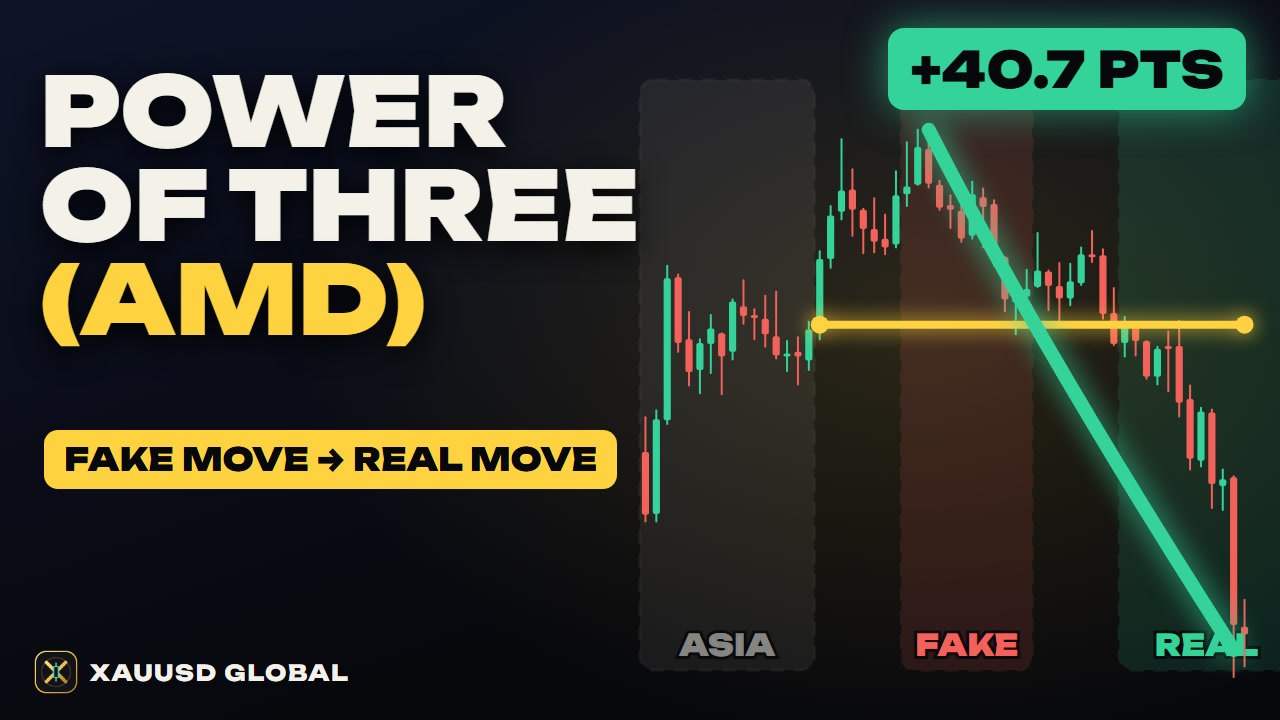
Power of Three (AMD) on Gold: The Fake Move and the Real Move