London Session Gold Trading (XAUUSD): Open Drive and Judas Swing
The London session on gold (XAUUSD), from zero to the pro level, on real gold charts. You will learn what the London session is and its hours (08:00 to 17:00 London time, which is 03:00 to 12:00 New York time, and 07:00 to 16:00 UTC in summer or 08:00 to 17:00 UTC in winter), the pre-open hour and the overlap with New York, and the 2026 clock changes that move the London open to 04:00 New York for a few weeks; why volume and range jump at the open (median 1-hour range and volume measured for every London hour, with honest notes); what London does to the Asian range (counts on 547 days); three London patterns (the open drive, the Judas swing or fake move, and continuation into the New York overlap); a real failure; an honest test of the Judas fade on more than two years of gold data, shown as counts and R only; the filters that did and did not help; news risk at 08:30 New York; the pro routine and a flowchart.
Chapters
- 0:00A real London-session gold trade, start to finish
- 0:54The London session hours: New York time and UTC
- 2:02Why volume and range jump at the open (measured)
- 3:07What London does to the Asian range
- 4:05Three London patterns: open drive, Judas swing, continuation
- 5:19A real failure
- 6:04An honest test of the Judas swing
- 7:23Filters: what helped and what didn't
- 8:28News risk and the pro routine
- 9:27Should I trade this London move? (flowchart)
- 10:05Recap
Key points
London trades 08:00 to 17:00 London time: 03:00 to 12:00 New York time, 07:00 to 16:00 UTC in summer and 08:00 to 17:00 UTC in winter. The busiest part is the overlap with New York.
At the London open, range and volume rise, but less than many think; the big jump comes when New York joins.
Over 547 days London took only the Asian high on 206 days, only the low on 162, both on 14 and neither on 165.
Three patterns: the open drive, the Judas swing (a fake move, then reversal) and continuation into New York, which was close to a coin flip.
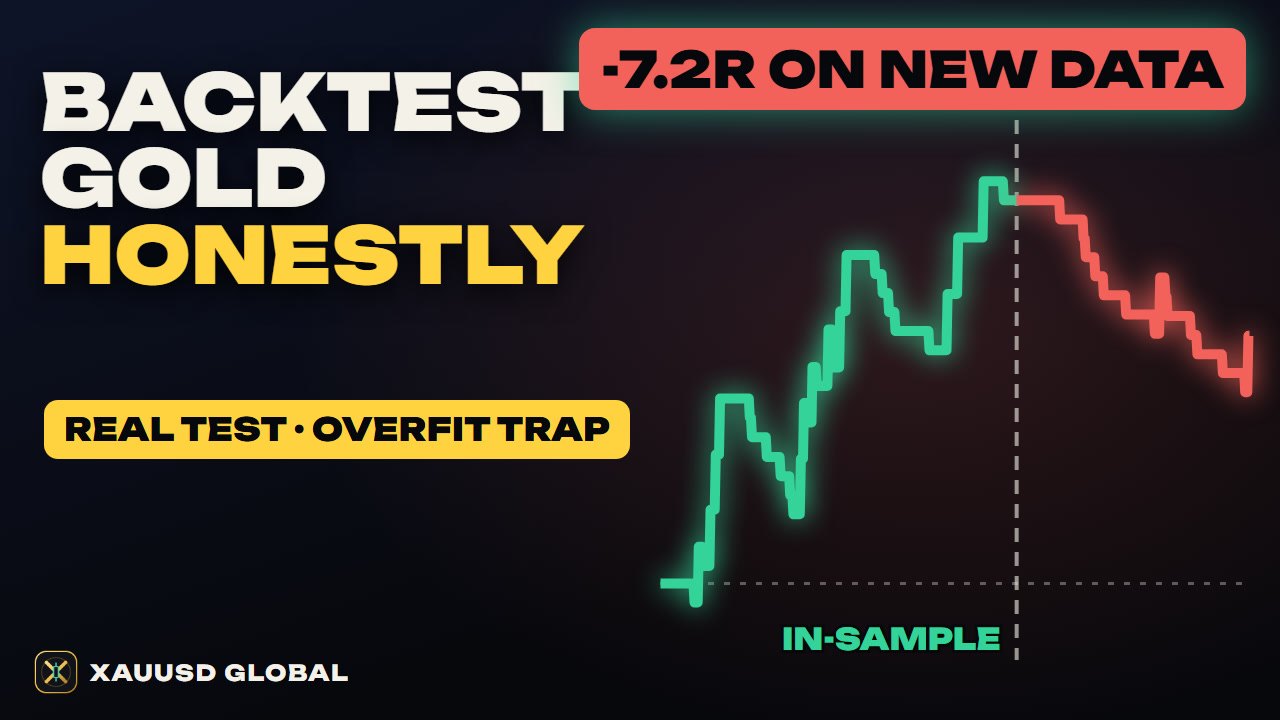
Our honest test of the Judas fade lost on 1-hour closes (250 trades, -107.2R after costs, every year negative) and no filter fixed it; following the London break did better. Nothing here promises profit.
Chart data: COMEX gold futures OHLC from Yahoo Finance (GC=F), times in UTC. Education only, not a signal.
Read more: London Session Gold Trading: How XAUUSD Behaves at the London Open · Asian Range Breakout on Gold: Trading the London Open Breakout and the Judas Fakeout on XAUUSD · ICT Kill Zones and the Silver Bullet Model on Gold (XAUUSD): Times, Rules and Honest Limits · London open · London new york overlap · Asian range · London fix
Transcript
Gold, fifteen minute chart, 10 September 2026. All night, price moved inside the Asian range. At 01:45 New York, the last candle of the range set the high. At 02:00 New York, 07:00 in London, the pre-open. One candle pushed 4.8 points above the high, then closed back inside. Buyers who chased the break were trapped. Sell at that close, stop at the sweep high, target the Asian low. By 05:00 New York, the target was hit: 26.7 points for 20 points of risk. And when New York arrived, price kept falling, 114.5 points from the high. This is the London session. You'll learn its hours in New York time and UTC, why volume jumps at the open, what London does to the Asian range, three patterns, a real failure, and an honest test of this exact trade.
Chapter one. What the London session is. London is the centre of the world's gold market. The big bullion banks trade there, and the LBMA gold price is set there twice a day, at 10:30 and 15:00 London time. The London session runs from 08:00 to 17:00 London time. In New York time, that's 03:00 to 12:00. The hour before, from 07:00 London, or 02:00 New York, is the pre-open. In UTC, it moves with British summer time. In summer, London is UTC+1, so the session is 07:00 to 16:00 UTC. In winter, London is on UTC, so it's 08:00 to 17:00 UTC. From 08:00 to 12:00 New York, London and New York are both open. This is the overlap, and it's usually the busiest part of the day. One trap. Britain and the US change their clocks on different dates. In 2026, the US moved on 8 March and 1 November, and Britain on 29 March and 25 October. In those weeks, London opened at 04:00 New York, an hour later than usual.
Chapter two. Why volume and range jump at the open. We measured every one hour gold candle from June 2024 to November 2026, by London hour. Each bar is the median size of that hour. The median is simply the middle value. In the quiet hours before London, from 04:00 to 07:00 London time, a typical hour moved 9.5 points. In London's first three hours, 11 points. On fifteen minute candles, the first one after the open was typically 8 points, against 6 for the one before. Volume tells a clearer story. It climbs hour by hour into the open, and London's first hours traded about 1.7 times the volume of those quiet hours. More traders means more orders, and the stops waiting at the Asian high and low get hit. Two honest notes. This is volume on a US futures exchange, so London's own bank trading isn't in it. And the biggest jump of the day comes later, at the New York overlap: 19.3 points an hour, on almost three times London's volume.
Chapter three. The London open and the Asian range. In the Asian range lesson, we marked the high and low from 19:00 to 02:00 New York. London's first job is to test that box. So we checked 547 days: what did price do between 02:00 and 05:00 New York? London took only the high on 206 days, and only the low on 162. It took both on just 14 days, and left the box alone on 165. So on most days, London takes one side. Then what? On 135 of those 368 days, price ran one full range further in the same direction first. On 87, it turned and reached the other edge first. On 144, neither happened by noon. So follow-through came first more often than reversal. Keep that in mind, because the most famous London pattern is the reversal.
Chapter four. Three London patterns. Pattern one, the open drive. 10 November 2026. The pre-open and the first London hour stayed inside the Asian range. Then the 04:00 New York candle, 09:00 in London, dropped 25.9 points and closed 13.1 points below the low, on 9,462 contracts. That's more than nine times a normal Asian candle. It never came back inside. One range lower by 05:15, and two ranges lower in the 08:30 New York candle, the usual time for US data. That's the open drive: a clean break, big volume, no return. Pattern two, the Judas swing, or fake move. You saw it in the cold open. On 10 September, the pre-open pushed above the Asian high, trapped the buyers, and the real move went down. Pattern three, continuation into the New York overlap. On both days, the London move kept going after 08:00 New York. But across all our days, the overlap went the same way as the London morning 278 times, and the other way 265 times. That's close to a coin flip, so never assume it.
Chapter five. A real failure. 12 November 2026. At 02:00 New York, a candle broke below the Asian low and closed outside. Then at 02:45, a candle closed back inside. It looks exactly like a Judas swing. So the fade trader buys at 3,970.5, with the stop under the sweep low, 9.9 points of risk, and the target at the Asian high. At 03:15 New York, fifteen minutes after London opened, the stop was hit. By 04:00, price was 31.1 points below the stop. This was the breakout from the Asian range lesson, on the same day. The close back inside was only a pause, not a reversal.
Chapter six. An honest test. We tested the Judas swing exactly as we traded it. Price trades beyond one Asian edge in the London window, and the first candle that closes back inside is the entry. Stop at the sweep extreme, target the other edge, and close at noon New York. One hour candles, 547 days, and costs of 0.30 per ounce. On paper it looks great: the target was typically about 3.6 times the risk. The result: 250 trades. Only 39 hit the target. 192 hit the stop, and 19 closed at noon. In total, minus 107.2R. That's about minus 0.43R a trade, and every single year lost. On fifteen minute candles, from the five minute data: 25 trades, and 22 were stopped. The total was minus 1R, close to zero, but only because one trade made 21.4R, with a stop of just 1.8 points. Without it, minus 22.4R. Now compare the breakout rule from the Asian range lesson, on the same days: 253 trades, plus 18.9R. Small and unstable, but positive. Following the London break worked better than fading it.
Chapter seven. Filters: what helped, and what didn't. Wider stops. We moved the stop further beyond the sweep: 10, 25, 50 and 100% of the range. Each one lost less: minus 61.1R, 50.6, 36.3, and 22.7. None of them made money. Range size. Small, normal and large Asian ranges all lost. Normal ranges, the best group in the breakout test, lost 42.5R here. The bigger picture. Fading only in the direction of the 20 day average lost 46R. Against it, 61.2R. Both lost. Entry time. Later entries lost less: 62.8R at 02:00, 28.2 at 03:00, and 16.1 at 04:00 New York. Still all losses. So no simple filter fixed this rule. A real Judas trade needs more proof, like a break of structure the other way, and its own test.
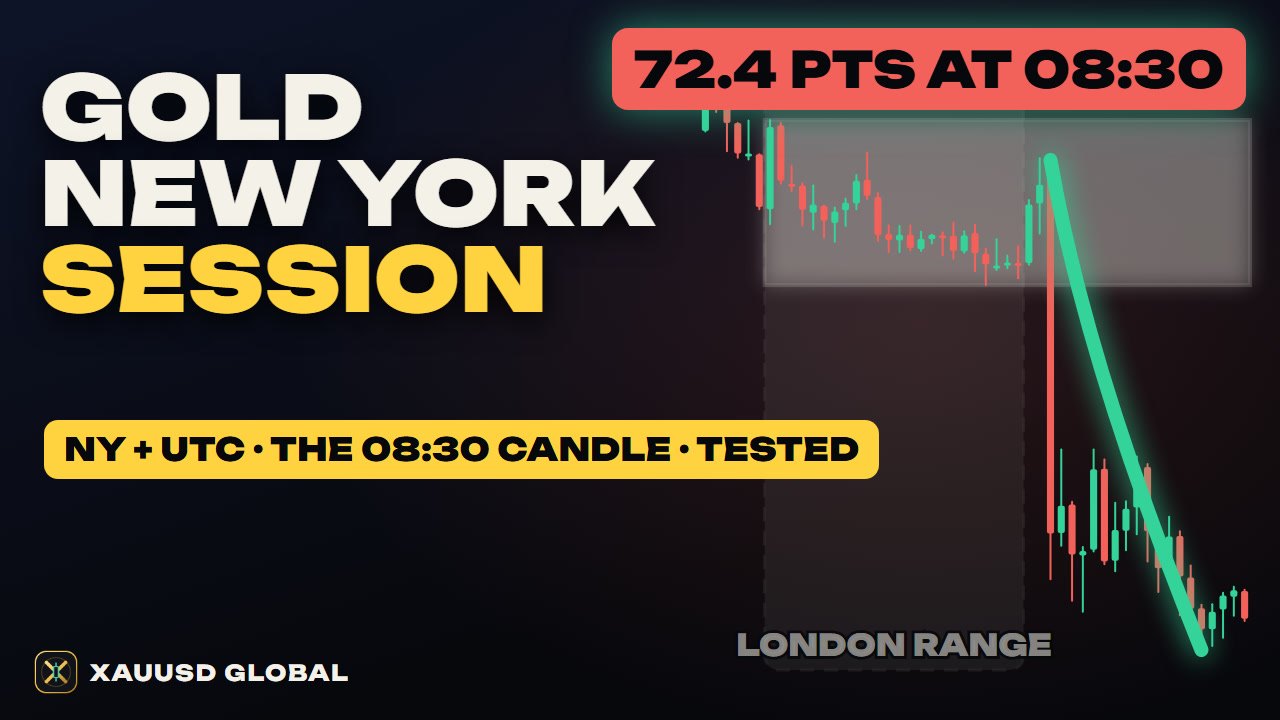
Chapter eight. News risk and the pro routine. US data often comes out at 08:30 New York. That's 13:30 in London, and 12:30 or 13:30 UTC. It lands right inside the overlap. We ranked the 20 biggest fifteen minute candles between 03:00 and noon New York, from September to November 2026. 9 of them were the 08:30 candle. The biggest moved 72.4 points, more than ten times a normal London morning candle. So pros run London like a routine. Before the open, mark the Asian range, yesterday's high and low, and the news calendar. Then write three scenarios: breakout, sweep and reversal, or no trade yet, each with a trigger and a point where it's wrong. Take one attempt per side. Treat the 10:30 London auction as a time to reassess. And on big data days, be flat or smaller before 08:30 New York.
Chapter nine. Should you trade this London move? Any no, and you wait. Is the Asian range marked, and have you checked the news calendar? If not, wait. Did a fifteen minute candle close outside the range between 02:00 and 05:00 New York? A wick that comes back is not a trade on its own. Is this the first attempt on that side? If not, skip. Is big US news due before the target? Then take profit early, or skip. If all is clear, it's the breakout plan: stop at the middle, target one range away, and a time stop at noon New York.
Let's recap. The London session runs from 08:00 to 17:00 London time. That's 03:00 to 12:00 New York, and in UTC, 07:00 to 16:00 in summer, 08:00 to 17:00 in winter. Volume climbs into the open, but the biggest moves come at the New York overlap and the 08:30 data. London usually takes one side of the Asian range, and follow-through came first more often than reversal. Fading the first push lost in every version we tested. The full written guide is on xauusdglobal.com. Subscribe for the next lesson, and come trade with us in the XAUUSD Global community. It's free during early access.
Other short videos
New York Session Gold Trading (XAUUSD): The Overlap and 08:30
Asian Range Breakout on Gold (XAUUSD): London Breakout and Fakeout
Trading Maths for Gold: Why a 70% Win Rate Can Still Lose