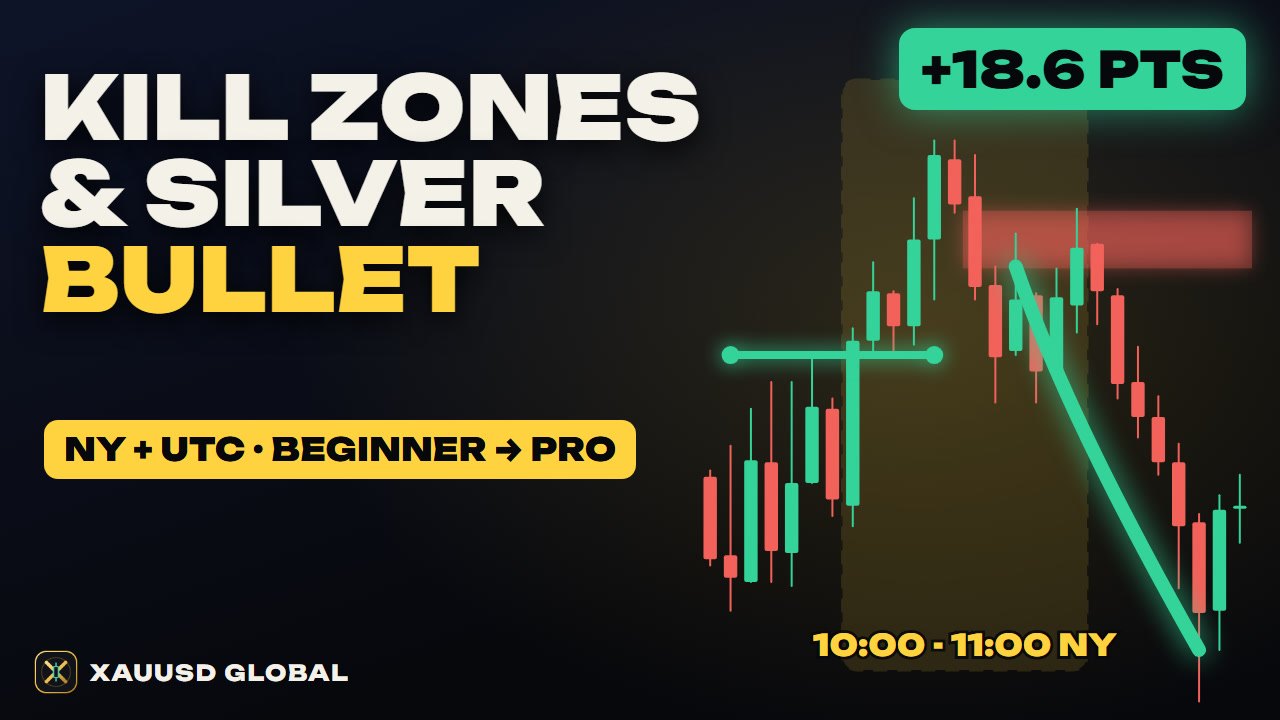
VWAP Trading Strategy on Gold: Beginner to Pro
VWAP from zero to the pro level, taught on real gold (XAUUSD) charts. You will learn what VWAP really is (the volume-weighted average price, the day's fair price), how it is built from typical price and volume, why funds and banks use it as a benchmark, session VWAP vs anchored VWAP, the standard-deviation bands, how to tell a trend day from a range day, the pullback-to-VWAP entry on trend days, fading the second band back to VWAP on range days, where the stop and targets go, when VWAP fails (a band fade on a day that became a trend day), and how pros grade a VWAP trade before they take it.
Chapters
- 0:00A pullback to VWAP on a trend day
- 0:51What VWAP really is
- 2:10Session VWAP vs anchored VWAP
- 3:17The standard deviation bands
- 4:09Trend day or range day?
- 4:57The pullback to VWAP: entry, stop, targets
- 5:50Fading the bands on a range day
- 6:44When VWAP fails
- 7:46Pro level: grading a VWAP trade
- 8:596 VWAP mistakes
- 9:31Should I take this VWAP trade? (flowchart)
- 10:09Recap
Key points
VWAP is the volume-weighted average price of the session: busy prices count more, quiet prices count less.
Session VWAP resets each day; anchored VWAP starts from a chosen point such as a major low.
On a trend day price holds on one side of VWAP and pullbacks to it are the entries; on a range day price crosses it often and the bands can be faded back to VWAP.
Stops go beyond the pullback low or the band extreme; targets are the session high or low, or VWAP itself for band fades.
A band fade on a day that turns into a trend day fails: check the day type before fading.
Chart data: COMEX gold futures OHLC from Yahoo Finance (GC=F), times in UTC. Education only, not a signal.
Read more: VWAP on Gold (XAUUSD): Session VWAP, Anchored VWAP, Bands and Setups · Vwap · Vwap bands · Tick volume
Transcript
Gold, one hour chart, 3 September 2026. The gold line is VWAP: the average price everyone paid today. Every hour, price closed above it. Buyers were in control. In the London morning, price pulled back and touched VWAP. The candle closed back above it. That close is the entry, with a tight stop just under the low. The first target, the high of the day so far, was hit within two hours. And gold kept climbing: 92.1 points above the entry by late morning in New York. The stop was never touched. In this lesson, you'll learn what VWAP is, session and anchored VWAP, the bands, trend days and range days, pullback entries, fading the bands, when VWAP fails, and how pros grade a VWAP trade.
Chapter one. What VWAP really is. VWAP means volume weighted average price. It's the average price of the day, but a price where lots of gold traded counts more than a price where only a little traded. Here's how it's built. For each candle, take the typical price: the high, plus the low, plus the close, divided by three. Multiply it by the volume. Add those up since the session started, and divide by the total volume. These are the first four hours of that September session. The third hour traded the most, so it moved VWAP the most. And VWAP ends above the simple average, because the busy hours traded higher. Why does it matter? Big funds and banks often judge their fills against VWAP. A desk buying a large order tries to pay less than VWAP. A desk selling tries to get more. So VWAP works like a fair price for the day. A simple way to read it: above VWAP, the average buyer today is in profit. Below it, the average buyer is losing. One honest note. Spot gold has no central volume. Every chart in this lesson uses COMEX gold futures, with real exchange volume. Your broker's chart uses tick volume, so its line will sit a little differently.
Chapter two. Session VWAP and anchored VWAP. A session VWAP starts fresh every trading day. Here, it resets at six in the evening, New York time, when the gold futures day begins. Watch the line stop, and start again. Early in the day, it moves fast. By the afternoon it's heavy, and one big candle barely moves it. Pick one reset time, and stick to it. An anchored VWAP starts from a point you choose, like a big swing low, and never resets. It's the average price paid by everyone who traded since that moment. Gold, four hour chart. We anchor it at the low of 30 October 2026. For two days, price chopped around the line. Then gold took off, and the pullback on 6 November stayed above it. The buyers since the low were still in profit. On 10 November, a candle closed below the line. Price climbed back above it for a few hours, then lost it again, and this time it stayed below. On 12 November, gold traded 174.7 points under the line.
Chapter three. The standard deviation bands. VWAP tells you the fair price. The bands tell you how far from fair price is right now. Measure how far each price traded from VWAP, weighted by volume. That distance is one standard deviation. Draw it above and below VWAP. Then draw it twice as far. Near VWAP, price is at fair value. At the first band, it's moving away. At the second band, it's stretched. Watch them on 30 September. Early on, the bands are tight, because little has happened yet. Then, as price swings, they widen. Many traders think price stays inside the second band almost all the time. Gold doesn't follow that rule, especially around news. Treat the bands as stretch zones, not as walls.
Chapter four. Trend day, or range day? The most useful question VWAP answers is: what kind of day is this? 3 September was a trend day. VWAP sloped up all day, and every hourly close was above it. Each pullback to the line was a chance to buy. 30 September was a range day. VWAP stayed almost flat, and price crossed it again and again: 7 times. On a day like this, a cross means nothing. So check two things: the slope, and the side. Sloping VWAP, price on one side: a trend day. Flat VWAP, price crossing it: a range day. The London and New York opens give the first clue. But it's only a guess, and it can change.
Chapter five. The pullback to VWAP, on a trend day. On a trend day, VWAP acts like a floor in an uptrend, and a ceiling in a downtrend. The setup is a pullback that touches it, and gets rejected. Back to 3 September. Price had stayed above a rising VWAP since the open. In the London morning, a candle dipped through VWAP, and closed back above it. That close is the entry. The stop goes under the low of that candle, plus a small buffer. And there's a second rule: if a candle closes back below VWAP, you get out, even before the stop. Targets: first, the high of the day so far. Then the upper second band. Both were hit the same day. Look at the risk: 6.6 points. Because the entry was right at the line, the stop could be tight.
Chapter six. Fading the bands, on a range day. On a range day, price tends to swing back to VWAP. So traders fade the edges. They sell at the upper second band, or buy at the lower one, and aim for VWAP. 30 September, New York morning. VWAP was flat, and price had already crossed it many times. Then one candle spiked above the upper second band, and closed back inside it. Sell on that close. Stop above the spike high, plus a buffer. Target: VWAP. The very next hour, price was back at VWAP. 18.5 points, for 13.9 points of risk. But this only works on range days. Two checks first. Is VWAP flat? And has price already crossed it today? If not, don't fade.
Chapter seven. When VWAP fails. 19 August 2026. In the New York morning, one huge candle shot above the upper second band, and closed just under it. It looks like the fade you just learned. Sell the close, stop above the high. The very next hour, the stop was gone. And gold kept going. By the end of the day, price was 80 points above that stop. It rode the upper bands for hours, and the bands kept widening with it. What went wrong? VWAP was rising. Every close since the London open was above it. And that candle had the biggest volume of the day so far. That's a trend day starting, not a stretch to fade. The other common failure is the cross. On a range day, price crosses VWAP again and again, so a cross alone is not a signal. Wait for a rejection that holds. And around big news, VWAP lags. Many traders stand aside before major US data.
Chapter eight. The pro level. Grading a VWAP trade. Pros grade every VWAP trade before they take it. What kind of day is it? Is price at the line? Is there a clear rejection? Is it an active session? And is there room to the target? 22 October 2026. Every hourly close since the open was below a falling VWAP. Trend day down. Check. At the London open, price rallied up into VWAP. Location. Check. The candle touched the line, and closed back below it. Rejection, at the London open. Check, and check. Stop 3 points above the candle high. First target, the low of the day so far. 26.5 points of room, for 12.8 points of risk. Room. Check. The target was hit five hours later, and the stop was never touched. Later that day, gold traded 72.1 points below the entry. A few pro habits. Write down your reset time and your volume source. Use anchored VWAP from big swing points on the bigger charts. And log every VWAP trade that failed, not just the winners.
Chapter nine. Six VWAP mistakes. One. Treating every cross as a signal. Two. Fading the bands on a trend day. Three. Changing the reset time from day to day. Four. Forgetting which volume your VWAP uses. Five. Using session VWAP on a daily chart. Use anchored VWAP there. And six. Opening a VWAP trade right before big news.
Chapter ten. Should you take this VWAP trade? Any no, and you skip it. Do you know your reset time, and your volume source? If not, skip. Does the setup fit the day? Pullbacks on trend days, band fades on range days. If not, skip. Did a candle reject the level and close back, not just touch it? If not, wait. Is it an active session, with no big news due? If not, wait. Can your stop go beyond the rejection, with room to the target? Then write down entry, stop and target. And only then, place the order.
Let's recap. VWAP is the average price of the day, weighted by volume: a fair price for the session. Session VWAP resets every day. Anchored VWAP starts from a point you choose. The bands show how stretched price is. Read the day first. On trend days, trade pullbacks to VWAP. On range days, fade the second band back to VWAP. And never fade a trend day. Next lesson: smart money concepts. The full written guide is on xauusdglobal.com. Subscribe so you don't miss it, and come trade with us in the XAUUSD Global community. It's free during early access.
Other short videos
Elliott Wave on Gold: 3 Rules, Fibonacci Targets, Real XAUUSD Trades
Volume Profile on Gold: POC, Value Area, HVN/LVN, Naked POC
Power of Three (AMD) on Gold: The Fake Move and the Real Move