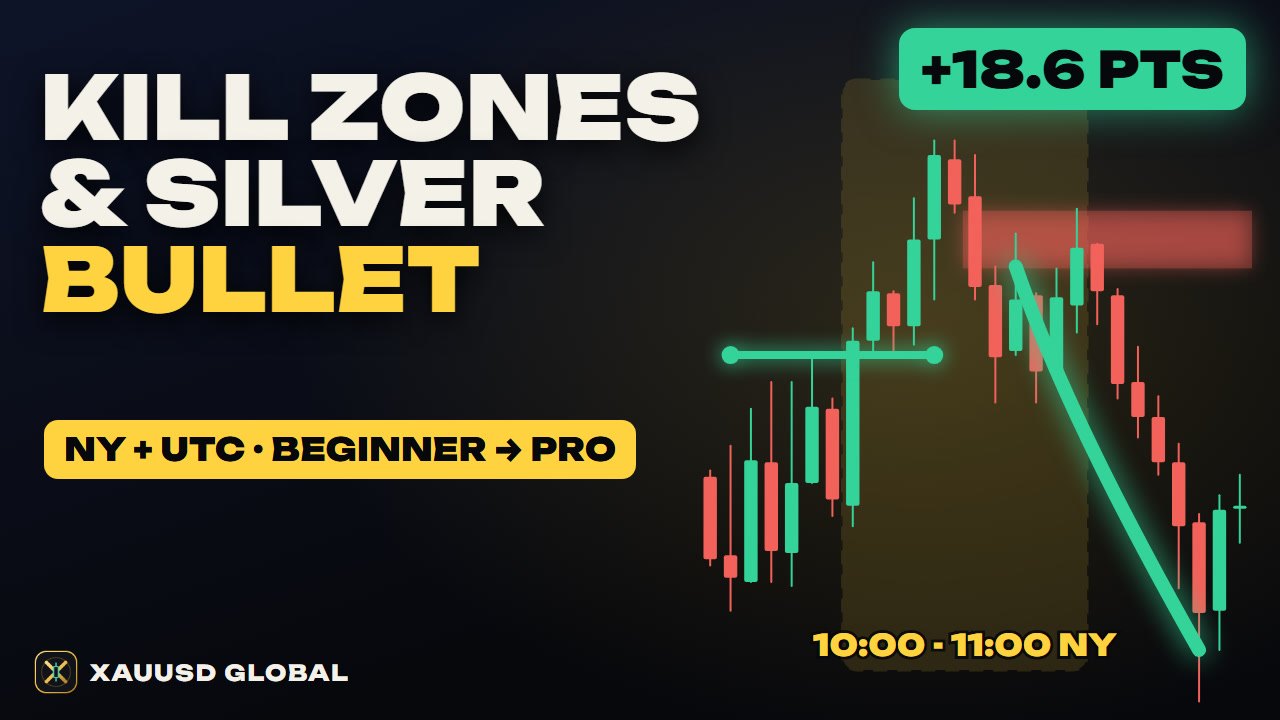
Liquidity Sweeps Explained: Beginner to Pro
Liquidity sweeps and stop hunts from zero to the pro level, taught on real gold (XAUUSD) charts. You will learn what liquidity really is (where stop orders sit, explained with a simple bus stop example), the places stops gather on gold (yesterday's high and low, the Asian range, equal highs and lows, round numbers), how to draw a liquidity map before the session, the four steps of a sweep and how to tell it from a real breakout, three ways to enter and the cost of each, why a stop inside the wick gets hit by the second probe, how to pick the target on the other side, why most bare sweeps fail, and how pros grade a sweep before they trade it.
Chapters
- 0:00A sweep of two highs at the London open
- 0:44What liquidity really is
- 1:43Where the stops sit on gold
- 2:32Sweep or breakout? The four steps
- 3:26Where to enter: three choices
- 4:15The stop: beyond the whole sweep
- 5:15The target: the other side
- 6:01When sweeps fail
- 6:58Pro level: grading a sweep, start to finish
- 8:366 mistakes sweep traders make
- 9:17Should I take this sweep? (flowchart)
- 9:53Recap
Key points
Liquidity is resting stop orders: buy stops above clear highs, sell stops below clear lows.
On gold, stops gather at yesterday’s high and low, the Asian range, equal highs and lows, and round numbers.
A sweep pokes through a level, takes the stops, closes back inside and then travels to the other side; a breakout closes and holds beyond the level.
A stop inside the sweep wick is often taken by a second probe; the stop belongs beyond the whole sweep.
Most bare sweeps fail: trade them only with trend, timing and a structure break, and show the failures in your own journal.
Chart data: COMEX gold futures OHLC from Yahoo Finance (GC=F), times in UTC. Education only, not a signal.
Read more: Liquidity Sweeps on XAUUSD: How Gold Stop Runs Work · Liquidity sweep · Stop hunt · Equal highs lows
Transcript
Gold, one hour chart. Before London opened, two highs sat almost on top of each other: yesterday's high, and the high of the Asian session. Above them, a crowd of stop orders. At the London open, price poked above both. By less than one point. The stops fired. And then the candle closed back inside. From that close, gold fell 85.2 points, straight down to yesterday's low. In six hours. That was a liquidity sweep. So why did this one work, when most of them fail? In this lesson you'll learn where stops hide, how to tell a sweep from a real breakout, where to enter, where your stop really belongs, and how pros grade a sweep before they trade it.
Chapter one. What liquidity really is. Think of a bus stop. Everyone waits at the same sign, because that's where the bus stops. Stop orders are the same. Traders park them in the same obvious places. Where? Just above a clear high, sellers put their stop losses, and breakout traders put buy orders. Just below a clear low, it's the other way round. When price touches those levels, all those orders turn into market orders at once. Above a high, that's a rush of buying. And a big seller loves a rush of buyers. If nobody new keeps buying after the rush, price falls back. That fall back inside the old range is a liquidity sweep. People call it a stop hunt. But a chart can't prove anyone hunted anything. So we'll just call it a sweep. Here's the opening candle again. The wick went above both highs and filled the stops. The body closed back below them. The wick is the sweep. The close is the proof.
Chapter two. Where the stops sit on gold. On gold, the same few places come up again and again. Yesterday's high and low. The Asian session's high and low, which London likes to test. Equal highs or equal lows. And round numbers. Before the session starts, mark them. Keep the strongest few above price, and the strongest few below. That's your liquidity map. Here's a real map. 9 June 2026, before New York opened. Yesterday's high, and the Asian high just 1.8 points under it. Two pools stacked into one big pool. Below, the Asian low, a round number, and yesterday's low. Buy stops above. Sell stops below. Now you know where to look, before anything happens.
Chapter three. Sweep or breakout? Every sweep starts out looking like a breakout. A sweep has four steps. One, price pokes through the level. Two, the candle closes back inside. Three, strong candles move away, and break the short term structure. Four, price travels to the liquidity on the other side. Step one alone is just a breakout. If the candles keep closing beyond the level, it is a breakout. Only steps two and three turn it into a sweep. So judge the close, never the wick. Back to 9 June. At nine in the morning, New York time, price ran 11.1 points above yesterday's high. The stops filled. But the candle closed back inside. That's step two. The very next candle was a big red one, more than three times an average candle, and it broke under the Asian low. Step three.
Chapter four. The sweep closed back inside. Where do you get in? You have three choices. A: enter on the close back inside. You never miss the move, but your stop is the furthest away. B: wait for price to come back to the swept level. A better price, but often it never comes back. C: wait for the small chart to break structure. The most proof, but you're later, and some of the room to the target is gone. Back to the opening chart. Entry A filled at the close. Entry B, waiting at the swept high? Never filled. Price didn't look back. Entry C filled one hour later, when price broke the last higher low. Same stop, so more risk, and less room left. No choice is free. Pick one rule before the trade, and keep it.
Chapter five. The stop. This is where most sweep traders lose. The wick is where the idea is wrong. So the stop goes beyond the very end of the wick, plus a small buffer. Not inside the wick. Not right at it. Why? Second probes. Gold often comes back and pokes the same level again. Look at 1 July 2026. At the London open, price swept the Asian low, and closed back inside. One hour later, it probed again. 2.9 points deeper. A stop one point under the first wick? Gone. A stop 3 points beyond the wick survived. But only by 0.1. On a broker's chart, with a spread, that could easily have been hit. That's how close this game gets. And then the move came. The Asian high first, then a run of 146 points. So: stop beyond the whole sweep, and a smaller size, so a wide stop costs you the same money.
Chapter six. Where do you get out? A sweep takes the liquidity on one side. The natural target is the liquidity on the other side. Sweep a high, aim for the lows. Sweep a low, aim for the highs. Check the room before you enter. If the first target is closer than your stop, you need a very good reason to take the trade. On 9 June, the sweep took the highs. The target was yesterday's low. Two hours later, price got there. 60.2 points, for 38.4 points of risk. Now watch what happened next. Price swept that low too, and closed back above it. Another sweep? No. The next hour fell 36.8 points lower. A sweep against a strong move is just a pause.
Chapter seven. When sweeps fail. And most of them do. We checked every simple sweep of yesterday's high or low in our own hourly data. Most of them did not reverse cleanly. Price went beyond the sweep's own extreme first, more often than not. Here's one that looked perfect. 30 October 2026. Equal lows just above 4000, the round number, and the Asian low, all stacked together. London ran through all of it. Then the next candle closed back above everything. A textbook sweep, right? Four hours later, price was back under the sweep low, and the stop was gone. By the end of the day, gold had fallen 127.9 points from that close. What went wrong? The four hour trend was down, with lower highs. And the sweep was a deep push, bigger than a whole average candle, not a small probe. In a downtrend, a sweep of the lows is often just a bounce.
Chapter eight. The pro level. Grading a sweep, start to finish. Pros don't ask, did price poke a level? They ask, was this level on my map, and does everything around it agree? Four hour chart, August 2026. On 10 August, gold left two equal lows. Sell stops underneath. Untouched for days. On the map. Check. The trend? Higher lows and higher highs. Check. On 14 August, price swept under the equal lows, a small probe compared with an average candle, and the four hour candle closed back above them. Check. A second probe held the same low. Then, at the London open, the one hour chart closed above its last lower high. Structure shift. Check. And room to the target: the August highs above, where buy stops were waiting. Check. The plan: entry C, on that London close. Stop 3 points under the sweep low. Target, just above the August highs. It wasn't smooth. Five days in, on the morning of 19 August, price came back within 15.5 points of the stop. Most traders would have panicked. But the stop held, and that same afternoon, price ran through the August highs. 109.3 points, for 37.3 points of risk. A few pro habits. Draw your map before the session, and save a screenshot. Judge the close, not the wick. Measure the sweep against the average candle. Stay out during big news. And log every failed sweep as what it really was: a breakout.
Chapter nine. Six mistakes that cost sweep traders money. One. Calling every break a sweep. Many breakouts are real. Fade them all, and you'll fight every trend day. Two. Entering before the close back inside. That's a guess, not a setup. Three. Labelling sweeps after the fact. Draw the map first, or you're fooling yourself. Four. Ignoring the trend. A sweep against a strong move is often just a pause. Five. A stop inside the wick. The second probe will find it. And six. No room to the target. If the other side is too close, skip it.
Chapter ten. Should you take this sweep? Any no, and you skip it. Was the level on your map before the session? If not, skip. Did a candle close back inside on your chart? If not, it's still a breakout. Wait. Did strong candles break structure the other way? If not, wait. Is it with the bigger trend, with no big news due? If not, skip, or trade much smaller. Can your stop go beyond the whole sweep, with room to the other side? Then write down entry, stop and target. And only then, place the order.
Let's recap. Stop orders gather above clear highs and below clear lows. A sweep pokes through them, then closes back inside. Map the levels before the session. Judge the close, not the wick. Wait for strong candles to break structure. The stop goes beyond the whole sweep. The target is the other side. Most bare sweeps fail, so the edge is in the context: your map, the trend, the time, and the room. And when a sweep fails, call it what it is: a breakout. Next lesson: RSI and MACD divergence. The full written guide is on xauusdglobal.com. Subscribe so you don't miss it, and come trade with us in the XAUUSD Global community. It's free during early access.
Other short videos
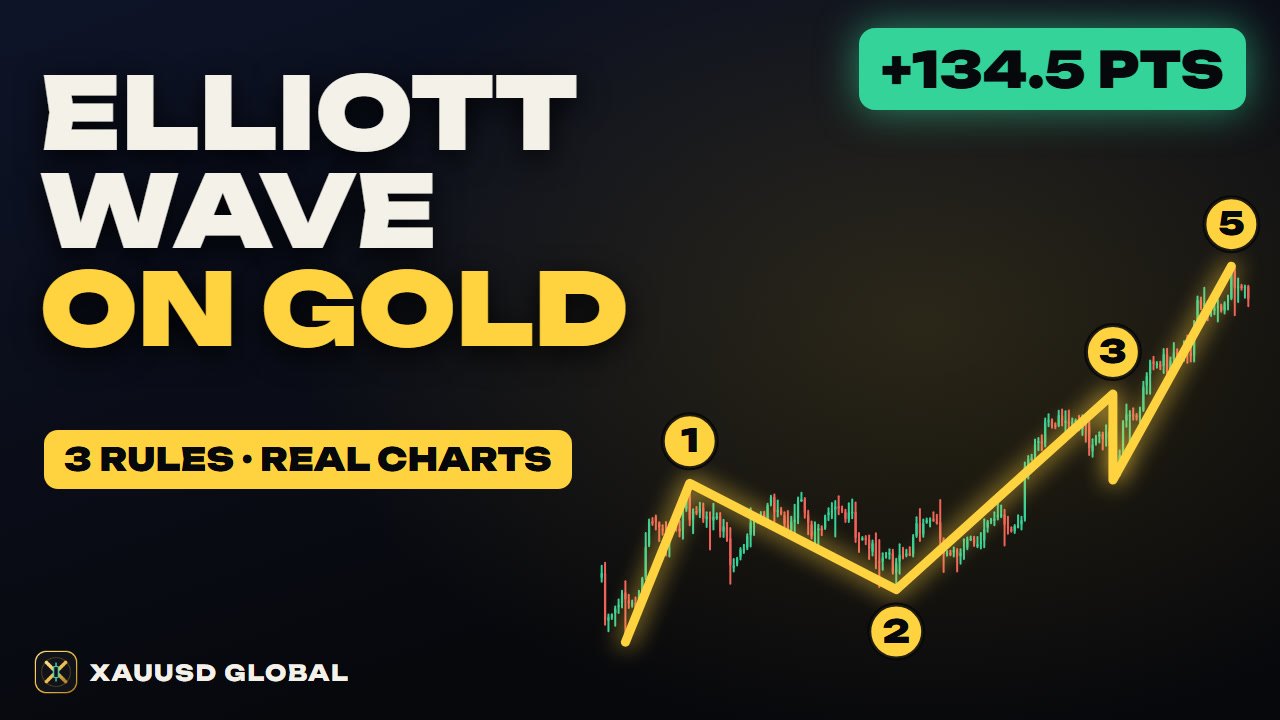
Elliott Wave on Gold: 3 Rules, Fibonacci Targets, Real XAUUSD Trades
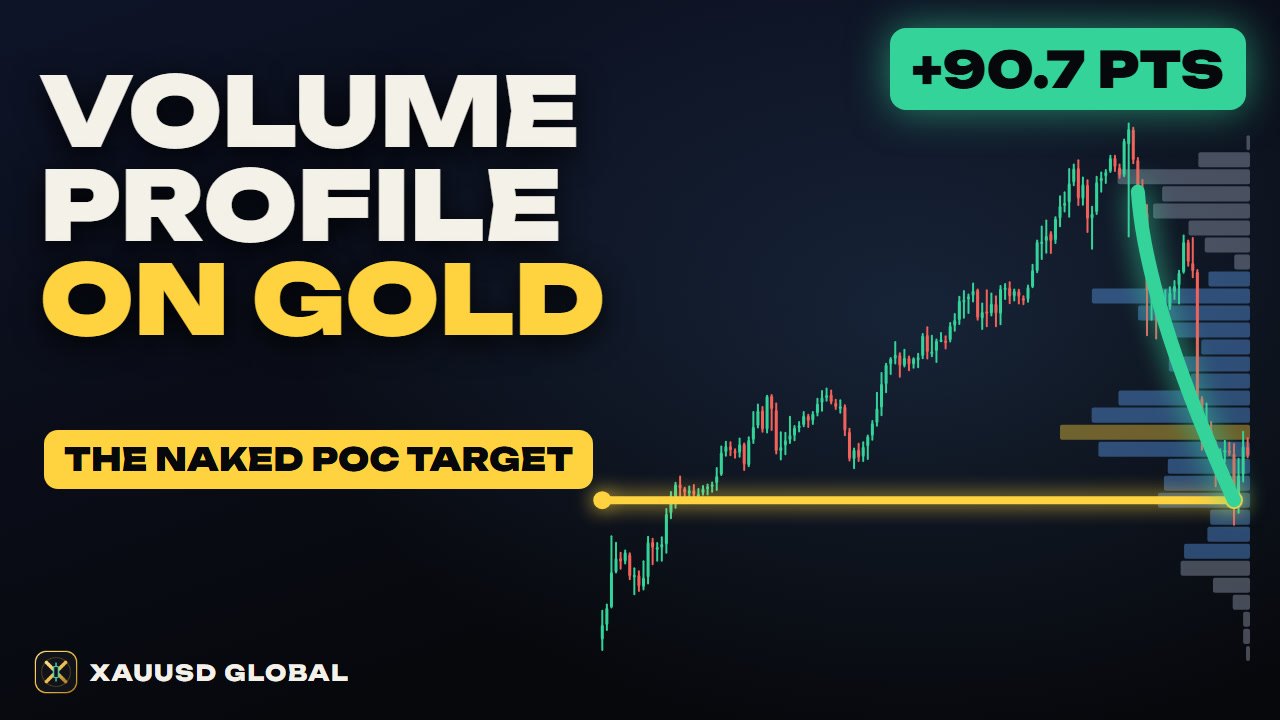
Volume Profile on Gold: POC, Value Area, HVN/LVN, Naked POC
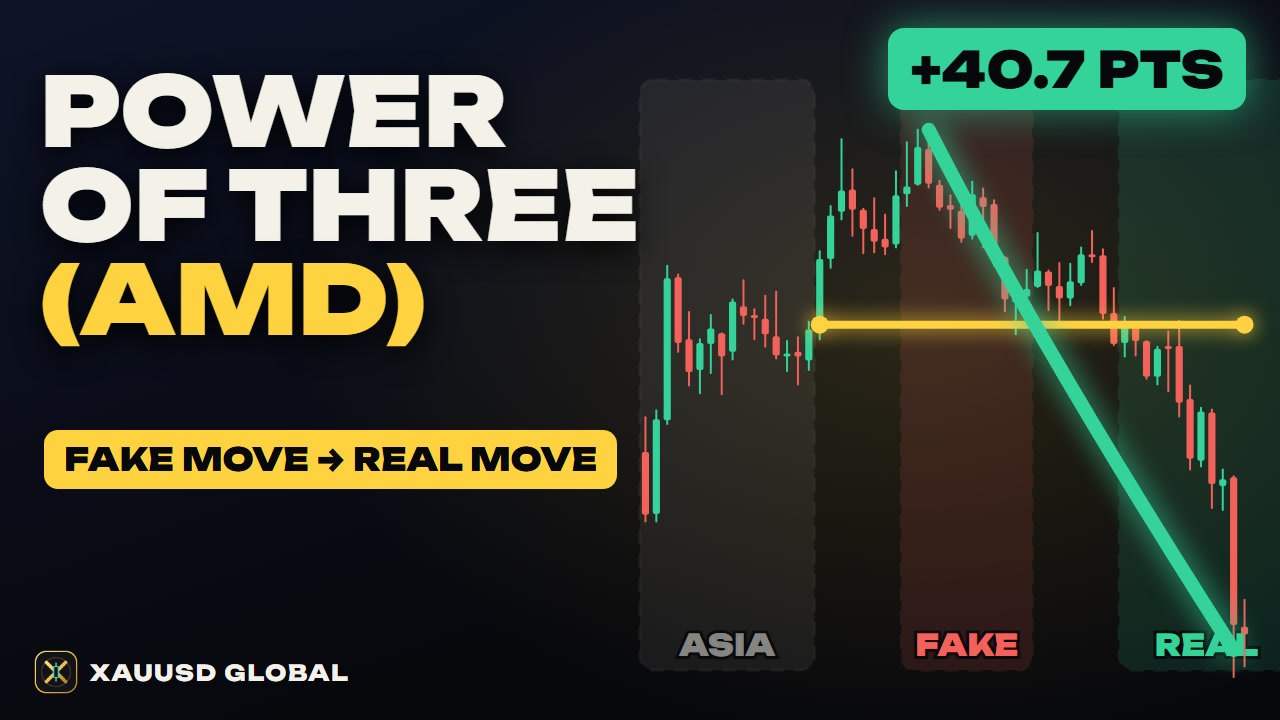
Power of Three (AMD) on Gold: The Fake Move and the Real Move