Support and Resistance on Gold (XAUUSD): Step by Step
How to find and trade support and resistance on gold (XAUUSD), explained simply, from beginner to pro: what a floor and a ceiling are; why prices remember (people wait at the same prices, round numbers, hidden stop orders); why gold levels are zones, not lines, and how thick to draw them with the daily ATR; a ten-minute routine (daily, four-hour, one-hour, rank and clean); how to trade a level (wait for a rejection candle, stop beyond the zone plus a buffer, target the next zone); three real trades on the chart (a floor that held, a ceiling that held, and a floor that turned into a ceiling); why stops get hit at levels; and a seven-point checklist.
Chapters
- 0:00One real trade: the 4,000 floor becomes a ceiling
- 0:39What support and resistance are
- 1:15Why prices remember
- 2:03Zones, not lines (and how thick)
- 2:47The ten-minute routine
- 3:40How to trade a level
- 4:27Trade one: the floor holds
- 5:49Trade two: the ceiling holds
- 7:21Trade three: the floor becomes a ceiling
- 8:48Why stops get hit at levels
- 9:31Your checklist
- 10:02Recap
Key points
Support is a floor where buyers stepped in before; resistance is a ceiling where sellers did. Prices remember because traders wait at the same prices, round numbers and stop orders.
On gold, levels are zones, not lines: draw them from the extreme wick and at least 10% of the daily ATR(14) wide.
Trade a level only after a 1-hour candle reaches the zone and closes back outside it; stop beyond the zone plus a buffer, target the next zone.
Three real gold trades from the written rules (Nov 2026) reached their targets: 1.7R, 2.8R and 3.8R before costs.
A broken floor often becomes a ceiling, as the 4,000 zone did on 11-12 Nov 2026. Levels on gold often break, so always use a stop.
Chart data: COMEX gold futures 1-hour bars from Yahoo Finance (GC=F), times in UTC, 4-hour bars built from them. The three example trades were chosen because they reached the target; no win rate is claimed, and R values are before costs. Education only, not a signal.
Read more: How to Identify Support and Resistance on a Gold Chart · Gold Support and Resistance Strategy: Trading XAUUSD Levels · Support resistance · Supply demand zones · Atr · Gold Breakout and Retest Strategy for XAUUSD · XAUUSD Market Structure: Trends, BOS and CHoCH Explained · Liquidity Sweeps on XAUUSD: How Gold Stop Runs Work · XAUUSD position size calculator
Transcript
For two weeks in October, gold kept landing on the same spot. Just under 4,000. Five times it fell there, and five times it bounced, like a ball on a hard floor. Then on 11 November, the floor cracked. The next morning, price climbed back up and touched the old floor, from below. It could not get back in. And it fell 85.9 points, straight to the next floor. That's support and resistance. In this lesson: what floors and ceilings are, why prices remember them, how to draw them as zones, a simple routine to find them, and three real trades, step by step.
Chapter one. What support and resistance are. Think of a room. The floor stops you from falling. The ceiling stops you from going higher. A price chart has floors and ceilings too. Support is a floor: a price where falls have stopped before. Resistance is a ceiling: a price where rises have stopped before. Price bounces between them, like a ball in that room. And here's the magic part. When a floor finally breaks, it often turns into a ceiling. Like falling through a glass floor: now that glass is above your head.
Chapter two. Why prices remember. Imagine you bought a phone for 400 dollars, and its price dropped. When it climbs back to 400, what do you do? Many people sell, just to get their money back. Traders feel exactly the same, because nobody likes to lose. That feeling sits on the chart, at the same price, every time. Buyers who missed the last bounce wait at the same floor, with buy orders. Sellers who sold at a ceiling wait there again. And many stop orders hide just beyond the obvious levels. Round numbers matter too. 4,000 is easy to remember, so lots of orders sit there. So a level is simply a place where many people are waiting. That's why price reacts.
Chapter three. Zones, not lines. Here's the most common beginner mistake: drawing a level as one thin line. Gold is fast. It almost never stops at the exact same price. It overshoots by a few dollars, then turns. So draw a zone, like a thick cushion. The wicks of the turns give the edge. The cluster of turns gives the core. In this lesson, turns within 25 dollars of each other make one zone. How thick? A simple rule from our guide: use the daily ATR, the average daily range. About 5 percent for small intraday levels, 10 percent for four-hour zones, and 15 percent for daily zones.
Chapter four. The ten-minute routine to find levels. Step one: start on the daily chart. Mark yesterday's high and low, last week's high and low, and two or three obvious turning points. Step two: the four-hour chart. Add zones where price turned at least twice, or where it launched a strong move, a hundred dollars or more. Step three: the one-hour chart. Mark the Asian session range, and the round numbers near price, like 3,900, 4,000 and 4,100. Step four: rank and clean. Many turns, a big timeframe, a round number: that's a top level. A level that price ignored: delete it. Keep only four or five zones near price. A clean chart is a calm mind. If every line on your screen looks important, none of them is.
Chapter five. How to trade a level. Don't buy just because price touches a floor. Wait for proof. Proof is a one-hour candle that reaches the zone, or comes within 5 dollars of it, and then closes back out of it, in your direction. At a floor, that's a green candle closing above the zone. At a ceiling, a red candle closing below it. Entry is that candle's close. The stop goes beyond the far side of the zone, plus a 3 dollar buffer. Not on the line, where everyone else's stop sits. And the target is the near edge of the next zone. Floor to ceiling, or ceiling to floor. Think of a staircase: you step from one level to the next, never trying to jump the whole stairs at once.
Chapter six. Trade one: the floor holds. On 30 October, gold dropped hard, to 3,879.3, and bounced. On 2 November, it came back down and turned again, at 3,900.1. Two turns. So that's our floor: 3,879.3 to 3,900.1. On 3 November, in the Asian session, price came down again. One hour dipped to 3,904.1, right next to the floor, and closed green, at 3,918.4. That's the proof. The plan. Entry at 3,918.4. The stop goes under the floor's lowest wick, minus 3 dollars: 3,876.3. A risk of 42.1. The target is the next zone up: the old 4,000 floor, which was now a ceiling. Its bottom edge, 3,989.1. After the entry, price never went below 3,908.4. 20 hours later, it reached the target. 70.7 points. That's 1.7R. And it didn't stop there: later, it ran all the way to the next ceiling, 165.7 points from the entry.
Chapter seven. Trade two: the ceiling holds. On 5 November, gold hit 4,155.8, and then fell 121 dollars. A strong move like that marks a ceiling. The zone runs from 4,147.1 to 4,155.8. That's 10 percent of the daily ATR, under the high. On 9 November, very early, price climbed back up. One hour topped at 4,143.3, just under the ceiling, and closed red, at 4,129.0. The plan. Sell at 4,129.0. The stop goes above the ceiling, plus 3 dollars: 4,158.8. A risk of 29.8. The target is the next floor down: the 6 November zone, with its top at 4,044.5. Now watch this. Later that day, price spiked back up, to 4,157.7. That's above the old high, and just 1.1 dollars from the stop. A stop right on the line would have been taken. The buffer kept this trade alive. And then the ceiling did its job. On 10 November, price fell straight to the target. 84.5 points. That's 2.8R. And the next day it kept falling, to the 4,000 zone, 126.7 points from the entry.
Chapter eight. Trade three: the floor becomes a ceiling. Remember the 4,000 floor? From 23 October to 27 October, price turned there five times. The zone runs from 3,989.1 to 4,002.3, with the round number 4,000 right inside it. A top level. On 11 November, the floor broke. A four-hour candle closed at 3,983.8, below the whole zone. Early on 12 November, price came back up, to 4,005.9, right into the old floor. That hour closed red, below the zone, at 3,986.0. The glass floor was now a ceiling. The plan. Sell at 3,986.0. The stop goes above the retest high, plus 3 dollars: 4,008.9. A risk of 22.9. The target is the next floor down: our first floor, from trade one. Its top, 3,900.1. Price never got back above 3,990.5. At 8 a.m. New York, it crashed through the target. 85.9 points. That's 3.8R. The same zone, used three times: first as a target, then as a floor that broke, then as a ceiling. Levels have long memories.
Chapter nine. Why stops get hit at levels. The most common complaint: price touched my support, hit my stop, and then went up without me. Usually, the stop sat exactly on the obvious level, where everyone's stop sits. Price dips through, takes those stops, and turns. The fixes are simple. Draw zones, not lines. Put the stop beyond the zone, with a buffer. Make the position smaller, so the wider stop costs the same. And remember the spread. A buy is closed at the bid price, so around big news, your stop can be hit even if your chart never touched it. And when you sell into a floor, set the target a little above it.
Chapter ten. Your support and resistance checklist. One: levels from the daily and four-hour charts first. Two: zones, not lines, sized with the ATR. Three: two turns or more, or a strong move away. Four: only four or five zones near price. Five: wait for a candle that rejects the zone. Six: the stop beyond the zone, plus a buffer. Seven: the target at the next zone. All seven, or no trade.
Let's recap. Support is a floor, resistance is a ceiling, and they exist because people remember prices, and wait there. Draw zones, not lines. Find them with the routine, rank them, and keep the chart clean. Wait for proof, put the stop beyond the zone, and aim for the next one. Three real trades: 1.7R at a floor, 2.8R at a ceiling, and 3.8R when a floor turned into a ceiling. The same steps, every time. The full written guide is on our website, link in the description. Subscribe for the next lesson, and join our gold community, to learn with other gold traders.
Other short videos
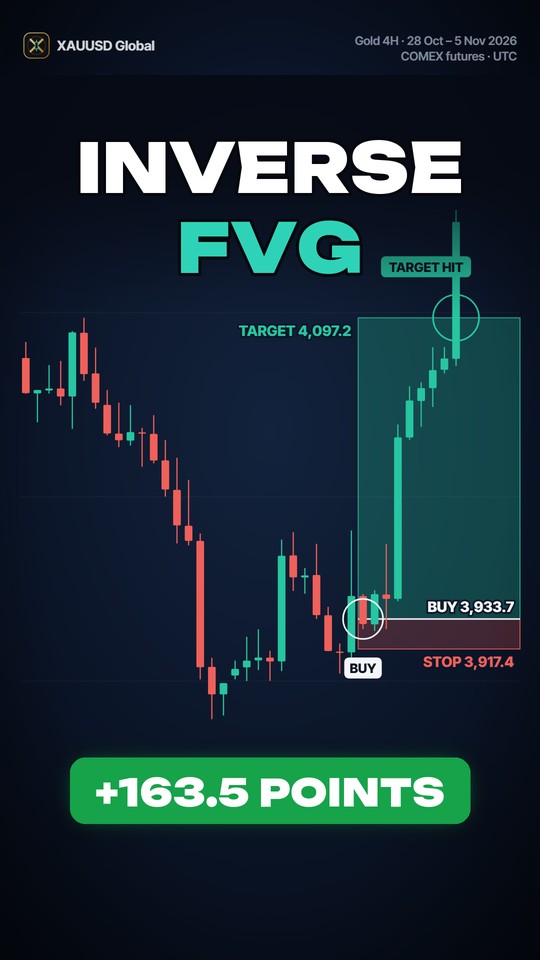
Inverse Fair Value Gap: When the Gap Fails and Flips
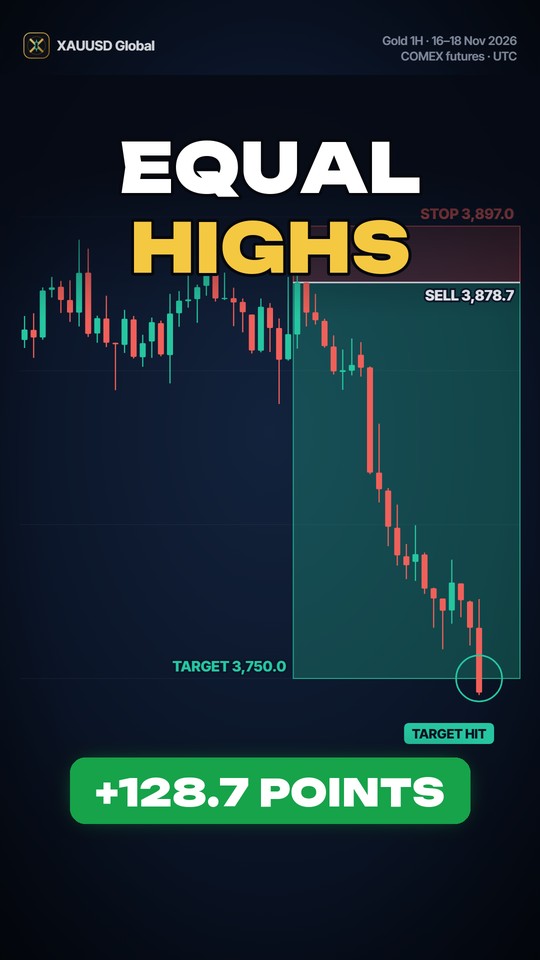
Equal Highs on Gold: Where the Stops Get Grabbed

Trendlines and Channels on Gold (XAUUSD): Step by Step