The Best Indicators for Gold (XAUUSD): Step by Step
The best indicators for gold (XAUUSD) trading, explained simply, from beginner to pro: why indicators come second (they are made from price, so they lag); one tool for each job (trend: EMA; momentum: RSI and MACD; risk: ATR; volatility: Bollinger Bands; intraday: VWAP); simple combinations by trading style; the RSI as a speedometer; a three-indicator plan (the 50 EMA trend, a pullback to the 20 EMA, the RSI turning, the stop 1 ATR beyond the swing, a 2R target); three real trades on the chart (an August buy, a September buy and an October sell); why indicators can't see the news; the mistakes to avoid and a six-point checklist.
Chapters
- 0:00One real trade: three indicators agree
- 0:44Indicators come second
- 1:30One tool for each job
- 2:31Simple combinations by style
- 3:14The RSI, simply
- 4:01The three-indicator plan
- 4:47Trade one: the August buy
- 6:00Trade two: the September buy
- 6:55Trade three: the October sell
- 7:46Indicators can't see the news
- 8:14The mistakes to avoid
- 8:43Your checklist
- 9:10Recap
Key points
Indicators are made from price, so they always come second: read the chart first, then use an indicator to check it.
Use one tool for each job: the EMA for trend, the RSI and MACD for momentum, ATR for risk, Bollinger Bands for volatility and VWAP for intraday levels. Two or three are enough.
The RSI works like a speedometer: it shows how fast price is moving, not where it must turn.
The three-indicator plan: a 4-hour trend beyond a sloping 50 EMA, a pullback to the 20 EMA, the RSI turning back with the trend, a stop 1 ATR beyond the swing and a 2R target.
Three real gold trades from the written rules (14 Aug 2026, 19 Sep 2025 and 29 Oct 2026) reached their 2R targets before costs; indicators cannot see the news, so check the calendar.
Chart data: COMEX gold futures 1-hour bars from Yahoo Finance (GC=F), times in UTC, 4-hour candles, EMA 20 and 50, RSI(14) and ATR(14) built from them. The example trades were chosen because they reached the target; no win rate is claimed, and R values are before costs. Education only, not a signal.
Read more: Best Indicators for Gold Trading: What Works on XAUUSD and How to Combine Them · Best RSI Settings for Gold (XAUUSD): Tested on 2 Years of Data · Best EMA for XAUUSD: 9/21, 20/50 and 200 EMA Tested on Gold · MACD on Gold: Lines, Histogram, Zero-Line and Divergence for XAUUSD Traders · RSI and RSI Divergence on Gold: Regimes, Divergence Types and Failure Swings · VWAP on Gold (XAUUSD): Session VWAP, Anchored VWAP, Bands and Setups · ATR and Bollinger Bands on Gold: Volatility-Based Stops, Squeezes and Position Sizing · Rsi · Macd · Atr
Transcript
In August, three simple indicators lined up on the four-hour chart. The trend line, the 50 EMA, pointed up. Price dipped back to the faster 20 EMA. And the RSI, which had dropped to 42.5, turned back up. That was the buy, at 4,425.8. The stop went one ATR below the swing, the target at 2 times the risk. A week later, it was hit: 192.0 points. That's how to use indicators on gold. In this lesson: why they come second, one tool for each job, simple combinations, a three-indicator plan, and three real trades, step by step.
Chapter one. Indicators come second. Every indicator is made from price. It's a calculation of what price already did. So it always arrives a little late, like thunder after lightning. The lightning is price. The thunder is the indicator. That doesn't make indicators useless. It means price and levels come first, and indicators help you check. Think of them as the dashboard of a car. Useful, but you still look at the road. Nobody drives by staring only at the speedometer. Indicators do three jobs. Direction: am I trading with the trend? Timing: is momentum fading or building? And risk: how far does gold normally move, so where should my stop go?
Chapter two. One tool for each job. For direction, use moving averages: the 20, 50 and 200 EMA. Price above a rising 50 EMA means buyers are in charge. For momentum, use the RSI, 14 periods, or the MACD, 12, 26 and 9. The RSI moves between 0 and 100. Above 50, momentum leans up. Below 50, it leans down. For risk, use the ATR, the average candle size. It tells you how much room your stop needs. For volatility, Bollinger Bands show calm and storm. And day traders add VWAP, the average price of the session. The trick is: one tool per job. Two momentum indicators don't give you twice the information. They give you the same information twice, and twice the confusion. A clean chart helps you think clearly, especially when money is on the line.
Chapter three. Simple combinations by style. A scalper, on one to five-minute charts, might use a fast EMA, VWAP and the ATR. A day trader, on fifteen-minute to one-hour charts, the 20 and 50 EMA, the RSI and the ATR. A swing trader, on four-hour and daily charts, the 50 and 200 EMA, the MACD and the daily ATR. Pick the row that matches how you trade, and stop adding tools. In this lesson we use three on the four-hour chart: the 50 and 20 EMA for direction and the pullback, the RSI for timing, and the ATR for the stop.
Chapter four. The RSI, simply. RSI means relative strength index. Think of it as a speedometer for price. It doesn't show where you are. It shows how fast you're going. In an uptrend, the RSI often dips toward 50 or a bit lower during a pullback, like a car slowing for a bend. When it turns back up, the trend is speeding up again. That's our timing signal. It's like a runner catching his breath, then starting to run again. Forget the old idea of selling just because RSI is above 70. In a strong gold trend, the RSI can stay high for days. Use it with the trend, not against it. High RSI in an uptrend means strength, not danger.
Chapter five. The three-indicator plan. Here's the plan for all three trades. One, trend: price on the trend side of a sloping 50 EMA. Two, pullback: a candle touches the 20 EMA and closes back on the trend side. Three, timing: the RSI dipped to 50 or below in the last three candles, and turns up on this one. For a sell, the mirror. Entry is that close. Four, risk: the stop goes one ATR beyond the pullback's swing. Wide, so the position is small. Five: the target at 2 times the risk. Write every number down before you click. If one of the three indicators disagrees, there is no trade. Waiting is free.
Chapter six. Trade one: the August buy. On 14 August, the four-hour close was 4,425.8, above a rising 50 EMA at 4,363.8. Trend: up. The candle had dipped to 4,398.1, through the 20 EMA at 4,422.2, and closed back above it, green. The pullback. The RSI had dropped to 42.5 in the candles before. Now it turned up, to 52.9. The timing. All three indicators agree. The stop: the swing low, 4,365.5, minus one ATR of 35.7. That's 4,329.8. A risk of 96.0. A wide stop, so a small size. The target, 2R: 4,617.8. The next week, gold broke out of its box and climbed. Price never went below 4,378.0. On 21 August, the target was hit. 192.0 points.
Chapter seven. Trade two: the September buy. September 2025. On 19 September, gold closed at 3,704.2, above a rising 50 EMA at 3,680.1. The candle had dipped to 3,676.2, under the 20 EMA, and closed back above it. The RSI had dropped to 44.7, and turned up to 54.1. Three green lights. The stop: one ATR below the swing low: 3,643.6. A risk of 60.6. The target: 3,825.4. Price never went below 3,699.8. On 29 September, the target was hit. 121.2 points.
Chapter eight. Trade three: the October sell. It works the same way down. On 29 October, gold was below a falling 50 EMA, at 4,081.2. A candle poked up to 4,081.0, above the 20 EMA, and closed red below it, at 4,051.1. The RSI had risen to 59.4, and now turned down to 47.2. Three red lights. Sell. The stop: one ATR above the swing high: 4,124.6. A risk of 73.5. The target: 3,904.1. Price never got back above 4,058.0. The next day, the target was hit. 147.0 points.
Chapter nine. Indicators can't see the news. Here's the most important warning. No indicator knows that a big U.S. jobs report is coming in the New York morning. When the news hits, price can jump fifty dollars in a minute, through every line on your chart. So check the calendar first. Don't open a new trade right before big news. Your indicators will thank you. And so will your account.
Chapter ten. The mistakes to avoid. Mistake one: indicator soup. Five indicators on one chart, all saying the same thing. Mistake two: selling just because RSI is above 70 in a strong uptrend. Mistake three: changing the settings after every loss, looking for the magic number. There isn't one. Mistake four: ignoring price and levels, and trusting the indicator alone.
Chapter eleven. Your indicator checklist. One: one tool for each job. Two: price on the trend side of a sloping 50 EMA. Three: a pullback to the 20 EMA, closing back on the trend side. Four: the RSI turning in the trend direction. Five: the stop one ATR beyond the swing, and a 2R target. Six: no big news due. All six, or no trade.
Let's recap. Indicators come second: they're made from price, so they lag. Use them to check direction, timing and risk. One tool for each job: the EMA for trend, the RSI for timing, the ATR for the stop. When all three agree, you have a plan. Three real trades: 192.0 points in August, 121.2 in September, and 147.0 in October. The same steps, every time. The full written guide is on our website, link in the description. Subscribe for the next lesson, and join our gold community. It's free, and you'll learn with other gold traders.
Other short videos
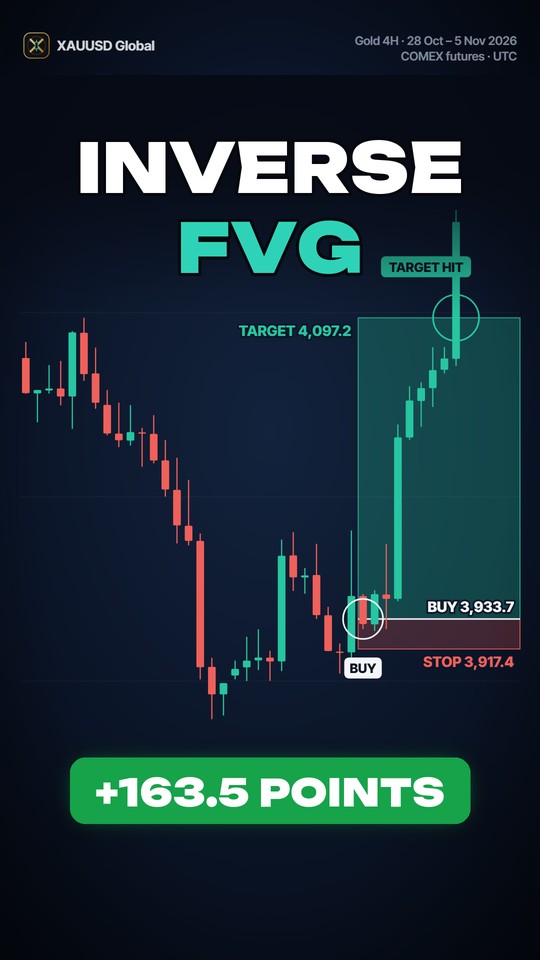
Inverse Fair Value Gap: When the Gap Fails and Flips
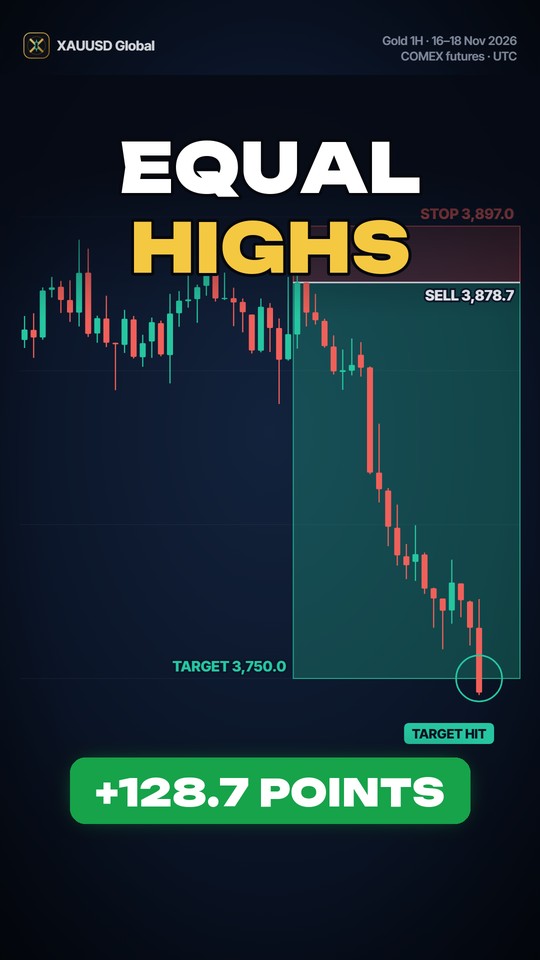
Equal Highs on Gold: Where the Stops Get Grabbed
Trendlines and Channels on Gold (XAUUSD): Step by Step