Order Blocks Explained: Beginner to Institutional
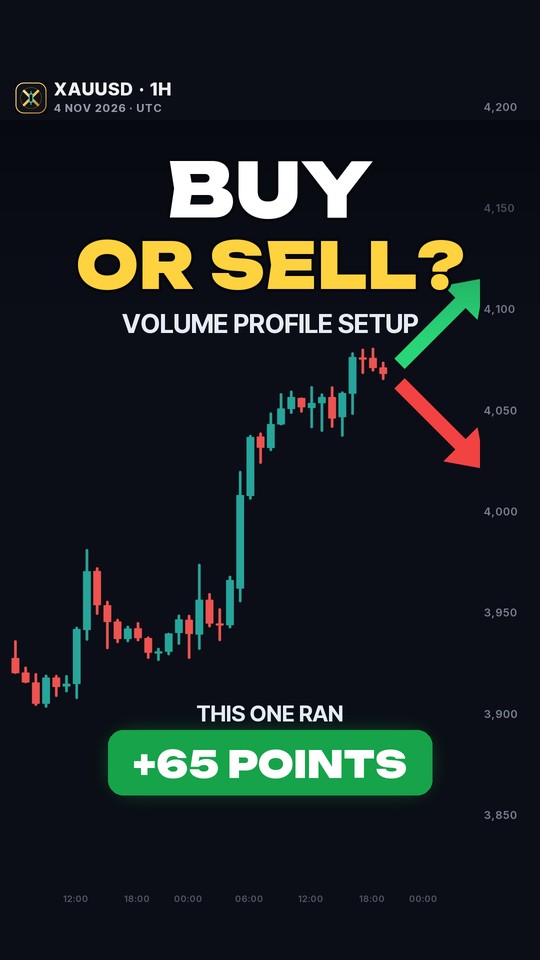
Our full order block lesson on real XAUUSD charts, from the simple idea to the institutional model. It covers the five checks of a valid block, why trend and premium/discount come first, three ways to enter, continuation vs reversal blocks, how blocks fail and flip into breakers, when a re-entry makes sense, and a full case study: a 4-hour buy block in July 2026 that ran 148.6 points to its target.
Chapters
- 0:00Cold open: a 148.6-point order block trade
- 0:26What an order block really is
- 1:26Real or fake: the 5 checks of a valid order block
- 2:35Trend first: structure, BOS vs CHoCH, premium & discount
- 3:42How to enter: edge, mean threshold, confirmation (stop & target)
- 4:54Continuation vs reversal order blocks
- 5:44Why order blocks fail + breaker blocks
- 6:41Re-entry after a stop-out (and when not to)
- 7:56Institutional level: liquidity, mitigation, the full model
- 9:06Do's and don'ts
- 9:32Full case study, start to finish
Key points
An order block is the last opposite candle before a strong move: the last down candle before a rally, or the last up candle before a drop.
Five checks for a valid block: displacement, a break of structure, a fair value gap, unmitigated (first return only), and ideally a liquidity sweep before the move.
Trend first: buy blocks in discount in an uptrend, sell blocks in premium in a downtrend, using daily and 4-hour structure.
Three entries: the edge of the block, the 50% mean threshold, or a lower-timeframe change of character inside the block. Stop beyond the far side of the block.
A block that price closes through has failed and often flips into a breaker block; re-enter only once, and only while the higher-timeframe structure holds.
Chart data: COMEX gold futures (GC), 1-hour bars, 4-hour and daily bars built from them, UTC, 2025-2026. Education only, not a signal.
Read more: Order Blocks on XAUUSD: Identification, Refinement and Risk · Order block · Smart Money Concepts (SMC) for XAUUSD: A Balanced Guide
Transcript
Gold, four hour chart. Price drops into one small zone, and from there it runs 148.6 points, straight to the target. That zone is an order block. By the end of this video, you'll know how to find this zone, when it holds, when it fails, and the one check pros make before they ever trust an order block. We'll go from the simple idea to the full institutional model. Then we'll trade this exact chart, start to finish.
Chapter one. What an order block really is. Banks and big funds trade huge amounts of gold. They can't buy it all in one click. The price would run away before they finished. So they split the order into small pieces, and fill them quietly at a level they like. When they're done, price explodes away. But some pieces never get filled. Those orders still wait at that level. When price comes back, they can push it away again. So, the definition. A bullish order block is the last down candle before a strong move up. A bearish order block is the last up candle before a strong move down. We mark the whole candle, high to low. A real one. One hour chart, March 2026. The last red candle before a 79.6 point candle up. That's the order block. And a bearish one, February 2026. The last green candle, then a 118.5 point drop. When price came back, it fell 168.9 points.
Chapter two. Most order blocks people draw are fake. Five checks tell you which ones are real. One: displacement. The move away is strong and fast. Big candles, not a slow drift. Two: a break of structure. It closes beyond the last swing high, or swing low. Three: a fair value gap. A hole between the first candle's high and the third candle's low. Price moved too fast to trade both ways. Four: unmitigated. Price hasn't come back yet. Only the first return counts. And a bonus: liquidity swept first. Stops grabbed beyond a high or a low, right before the move. Two real charts. Look how they ended. The left one ran 114.1 points. The right one failed. Here's why. Left: a 79.6 point displacement, a clean break of the high, a 60.4 point gap, untouched until it came back. Four out of four. Right: the move away was only 16.2 points, smaller than the block. It closed just 5.2 points above the high. No gap. And it was against the four hour downtrend. Price went straight through it.
Chapter three. Even a perfect order block fails against the trend. So first, find the direction. In an uptrend, price makes higher highs and higher lows. In a downtrend, lower highs and lower lows. Breaking a swing with the trend is a break of structure, BOS. Breaking the other way for the first time is a change of character, CHoCH. The first warning of a turn. Now cut the last big swing in half. Above fifty percent is premium, expensive. Below is discount, cheap. In an uptrend, buy blocks in discount. In a downtrend, sell blocks in premium. Daily chart, May to June 2026. Lower highs, lower lows, and a daily close below the 4,395.6 low. The trend is down. Sells only. The swing's middle is 4,336.6. In mid June, price bounced above that line, into premium. That's where sellers want to be. That's top down analysis. Daily and four hour for direction. One hour for the zone. A lower timeframe for the entry.
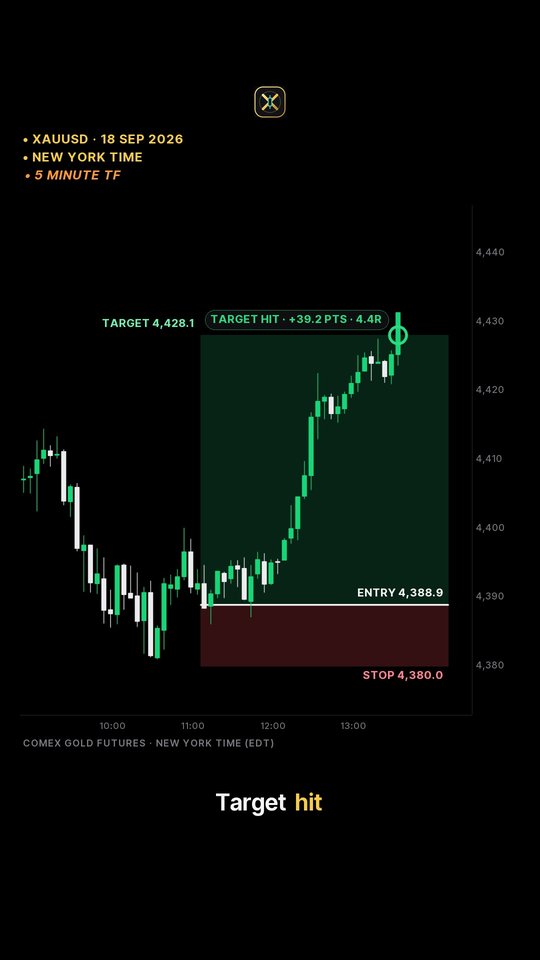
Chapter four. Where do you enter? Where's the stop? Where's the target? The four hour sell block from that bounce, right in daily premium. Here's how it ended: 101.3 points to the target. Let's rewind. Price spiked above two earlier highs and took their stops. Then one candle dropped 129 points, broke the last higher low, and left a gap. Every check, ticked. Entry one: the edge of the block. You get filled on the first touch, but you need the widest stop. Entry two: the mean threshold, the middle of the block. A better price, a smaller stop. But here, price never reached it. That's the trade off. Entry three: confirmation. Wait for the zone, drop to the one hour, and wait for a change of character. At the London open, a candle closed below the last higher low. Safer, but a worse price. The stop goes a few points beyond the far side of the block. The target is the next pool of liquidity: the low the drop came from. Watch it play out. The edge entry made 101.3 points, risking 49.8. The confirmation entry made 71, risking 44.8.
Chapter five. Some order blocks continue a trend. Some end it. A continuation block forms on a pullback inside a trend, right before price breaks structure the same way again. Four hour, April 2026. This one paid 191.7 points. Gold was trending up. A pullback candle made a higher low, then a 133.4 point candle broke the high. Price came back to the block, and the trend carried on. A reversal block forms at the end of a move. Price sweeps liquidity, then breaks structure the other way. A change of character. The June sell block was a reversal. The bounce swept the highs, then the drop broke the low. Continuation blocks go with the trend, so they need less proof. Reversal blocks need the sweep and the CHoCH.
Chapter six. Order blocks fail. Everyone gets stopped out by them. The skill is spotting the weak ones early. The warning signs. No displacement. Already mitigated. Against the higher timeframe trend. Buying in premium, or selling in discount. A level tapped again and again. A block so big your stop is huge. And news spikes, which blow through any level. A real failure. Four hour, August 2026. A bullish block broke structure, and gold rallied to 4,755. It looked perfect. But before price came back, the four hour closed below its last higher low. Then it made a lower high. The structure turned before the block was even touched. On 28 August, price fell into the block, and the same candle closed through it, 68 points down. The block failed. When price closes through an order block, it flips. Old support becomes resistance. That's a breaker block.
Chapter seven. You got stopped out. Should you get back in? Sometimes. Here's the rule. November 2025, four hour. This bullish block launched a rally to 4,250. Then price came back. Buy the top of the block, stop just under it. Just before the London open, price dipped and took the stop by only 2 points. Ask one question. Is the higher timeframe structure intact? The rally started from the 3,991.0 low, and price stayed above it. The higher low held. The idea is still alive. Drop to the one hour and wait. A candle closes above the last lower high. A change of character. The last down candle before it is a new, smaller order block. Re-enter when price taps it, stop under the stop hunt low. On 28 November, gold reached the target. 205.3 points. The second way back in is the breaker. Remember the August block that failed? Price came back up to its underside, and from there it fell 143.2 points. The rule. One re-entry per idea, only with a fresh signal, never with a bigger size. If the higher timeframe low breaks, the idea is dead. Walk away. That's how you avoid revenge trading.
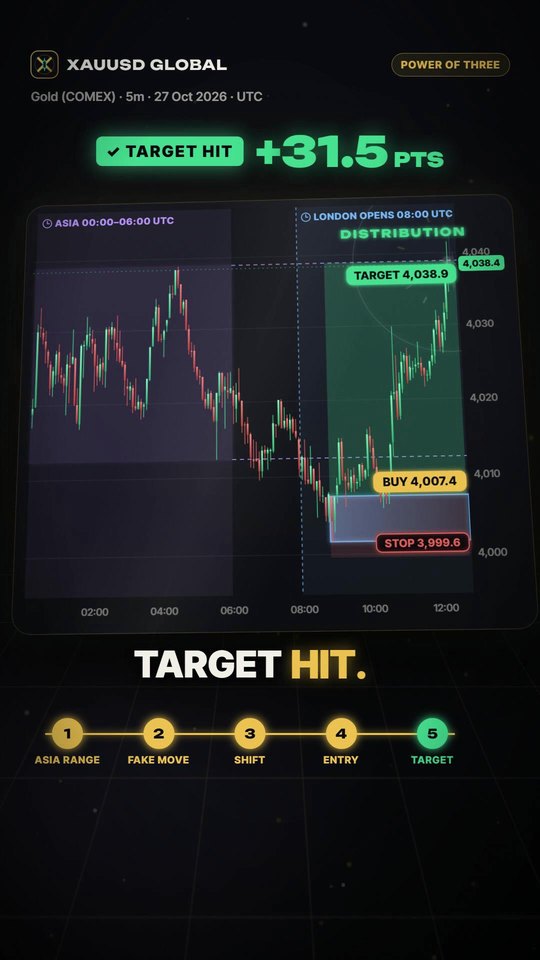
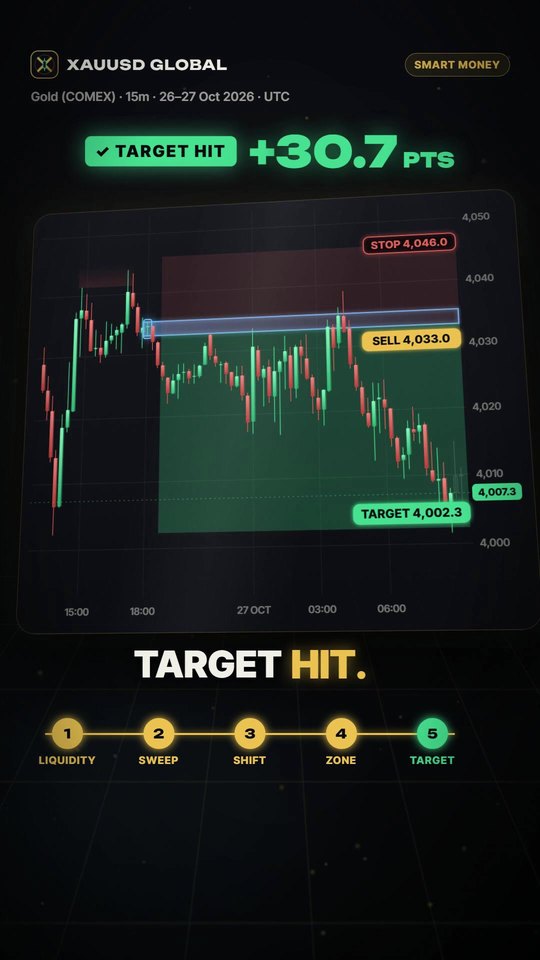
Chapter eight. The institutional level. This is where it all clicks. A fund that wants to buy a huge amount needs sellers. Where are they? Right under obvious lows, where traders put their stop losses. Every stop that gets hit is a sell order the big buyer can fill against. That's why the strongest moves start with a sweep. Price dips below a low, the stops fire, the big player fills, and price launches. Later, price returns to fill what was left. That's mitigation. So here's the one check pros make before they trust any order block. Did it form after liquidity was taken? No stops grabbed means no fuel. Skip it. The full model, in order. One, higher timeframe bias. Two, a liquidity sweep. Three, displacement and a break of structure. Four, a fair value gap. Five, the block in discount for buys, premium for sells. Six, timing: a killzone, like the London or New York open. Pros also refine. If a block is too wide, they look inside it on a lower timeframe for the exact candle that started the move. Same idea, tighter stop.
Chapter nine. Let's lock it in. Do: start with the higher timeframe trend. Wait for the sweep, the displacement and the break. Buy in discount, sell in premium. Stop beyond the block, target the next liquidity. Take the first touch. Don't box every candle. Don't trade against the trend. Don't re-enter twice, or bigger. Don't trade into big news. And never move your stop because you hope.
Chapter ten. Remember the trade from the start? Let's trade it, start to finish, like a pro. Daily chart first. After the June sell off, gold made a higher low in July, and price sat deep below the middle of the daily swing. Discount. Bias: buys only. Four hour. On 17 July, price swept a low. The stops were taken. Then a candle closed above the last high: a break of structure. The last down candle before it is our order block. It left a gap, and the rally reached 4,171.4. That high is the target. The block sits below the swing's middle, so it's in discount. And it formed after liquidity was taken. Every box ticked. Now we wait. On 28 July, price falls back into the block, sweeping another low on the way. Buy the top of the block. Stop just under it. Just 20.6 points of risk. On the one hour, price takes one more low. Then at the London open, a 62.7 point candle breaks structure up. The buyers are back. And it runs. Target hit. 148.6 points, for 20.6 points of risk. Order blocks aren't magic. They work when the trend, the liquidity and the timing agree, and they fail when they don't. Practise on past charts before you risk real money.
If this helped, subscribe for the next lesson. And to learn with other gold traders, join our community at community dot XAUUSD global dot com. It's free early access.