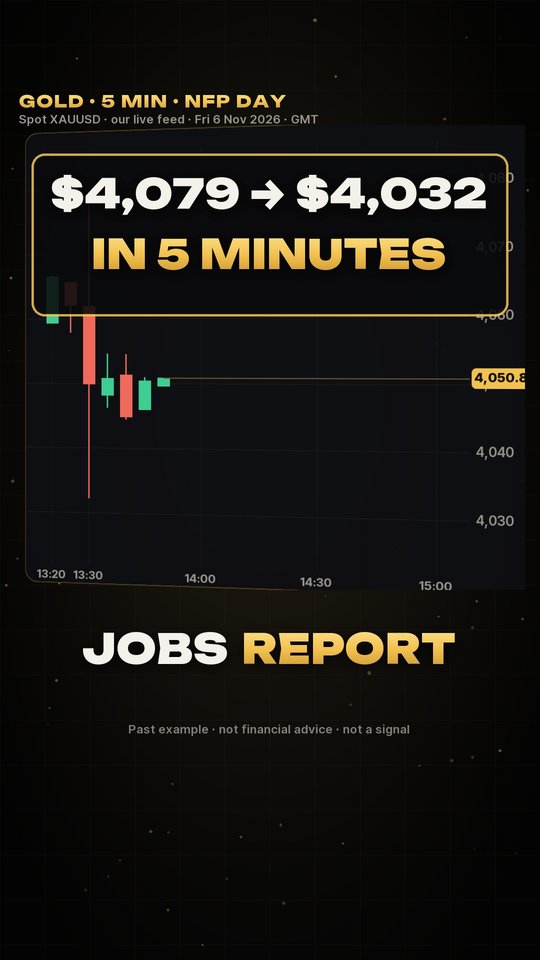
At a glance (Friday 6 November 2026): payrolls +165,000 vs about 65,000 expected · unemployment 4.1% (from 4.2%) · hourly pay +0.4% on the month, +3.1% on the year · August and September revised up 84,000 · gold $4,062 → $4,079 → $4,032 inside the first five minutes, low $4,028.59 at 14:30 GMT, about $4,051 at 15:00 GMT.
The short answer
The October jobs report was much stronger than expected. The US added 165,000 jobs, against a forecast of about 65,000. Unemployment fell to 4.1%, wages rose 0.4% in the month, and the two previous months were revised up by 84,000. Every part of the report pointed the same way: the job market is not cooling.
For gold, that is usually bad news in the short term, and that is what happened. In our live spot feed, gold first spiked up $17 to $4,079.25, then fell $47 to $4,032.26 inside the same five minutes. It drifted lower to $4,028.59 about an hour after the release, before bouncing back to around $4,051 by 15:00 GMT. The reason was the rates chain: a strong report makes a December Fed hike more likely, which lifts yields and the dollar.
Before the release, we set out the forecasts and scenarios in our NFP preview for 6 November. This post is the result.
When it came out
The report was released at 8:30 am New York time on Friday 6 November 2026, which was 13:30 GMT. The US is on winter time, so here is the same moment in a few other places:
| City | Local time of the release |
|---|---|
| New York | 08:30 Friday |
| London | 13:30 Friday |
| Frankfurt | 14:30 Friday |
| Dubai | 17:30 Friday |
| Mumbai | 19:00 Friday |
| Singapore | 21:30 Friday |
| Tokyo | 22:30 Friday |
| Sydney | 00:30 Saturday |
Every time in the rest of this post is GMT, with New York time where it helps. The full list by country is in our NFP time guide.
What the report said vs the forecast
All figures are from the official BLS Employment Situation release:
| Item | October 2026 actual | What was expected / before |
|---|---|---|
| Nonfarm payrolls | +165,000 | About +65,000 (forecasts of 59,000–65,000) |
| Unemployment rate | 4.1% | 4.2% in September, forecast to stay at 4.2% |
| Average hourly earnings, month | +14 cents (+0.4%) to $38.00 | Bank forecasts we saw were around +0.3% |
| Average hourly earnings, 12 months | +3.1% | |
| Average workweek | 34.4 hours | |
| Revisions to August + September | +84,000 combined |
Think of it like a school report card where the teacher expected a C and the student brought home an A, plus a note saying last term’s grades were also better than first marked. Three things made this report strong, not just one:
- The headline beat by about 100,000 jobs. That is a big miss for forecasters.
- Unemployment went down, not up. Fewer people looking for work.
- Revisions went up. The earlier months were stronger than first reported, so this was not a one-month fluke.
Wages rising 0.4% in a month also matters. When pay rises fast, companies may raise prices to cover it, which is the kind of inflation the Fed worries about.
Why the market cared: the rates chain
Gold does not react to jobs because of jobs. It reacts because of what jobs mean for interest rates. Here is the chain, step by step:
- Strong jobs mean the economy can handle higher interest rates without breaking.
- So the Fed has more reason to hike in December, or at least not to cut.
- Traders expect higher rates, so Treasury yields rise. The 2-year yield, which follows Fed expectations most closely, is the first to move.
- Higher US rates attract money into dollars, so the dollar firms.
- Gold pays no interest. When bonds pay more, holding gold costs more in missed income. And a stronger dollar makes gold more expensive for buyers using other currencies. So gold tends to fall.
That is what happened on Friday. Kitco reported that the 2-year Treasury yield rose about 6 basis points to 4.53% after the release, that the dollar was firmer, and that the data strengthened the case for a December hike. We could not find a verified figure for how far the 10-year yield or the dollar index moved in the hour after the release, so we leave those out. Our real yields and dollar tracker shows how they line up with gold over time.
How gold moved, minute by minute
The table uses 5-minute candles of spot XAUUSD from our live feed, in GMT. Your platform’s prices may differ by a little, but the shape will be the same.
| GMT | New York | What was happening | Open | High | Low | Close |
|---|---|---|---|---|---|---|
| 13:20 | 08:20 | Ten minutes before | $4,059.34 | $4,066.69 | $4,059.34 | $4,066.54 |
| 13:25 | 08:25 | Last candle before the release | $4,065.65 | $4,065.65 | $4,057.90 | $4,062.09 |
| 13:30 | 08:30 | Release candle | $4,061.92 | $4,079.25 | $4,032.26 | $4,049.87 |
| 13:35 | 08:35 | First pause | $4,048.20 | $4,054.57 | $4,046.25 | $4,050.78 |
| 13:40 | 08:40 | $4,051.32 | $4,054.52 | $4,044.49 | $4,044.86 | |
| 14:05 | 09:05 | The second leg lower begins | $4,047.70 | $4,048.60 | $4,036.69 | $4,037.57 |
| 14:15 | 09:15 | Back below the spike low | $4,036.66 | $4,038.77 | $4,030.80 | $4,033.44 |
| 14:30 | 09:30 | Low of the move | $4,034.64 | $4,042.94 | $4,028.59 | $4,035.82 |
| 14:45 | 09:45 | The bounce starts | $4,033.95 | $4,047.11 | $4,033.95 | $4,045.26 |
| 15:00 | 10:00 | One and a half hours after | $4,048.76 | $4,051.07 | $4,048.76 | $4,050.89 |
The first five minutes: both sides at once
Just before the release, gold closed the 13:25 candle at $4,062.09. Then the number hit the screens:
- First, gold jumped to $4,079.25, which is $17.16 above the pre-release close.
- Then, inside the same five-minute candle, it dropped to $4,032.26, which is $29.83 below the pre-release close.
- That one candle covered $46.99 from top to bottom, and closed at $4,049.87.
Why up first, when the news was bad for gold? In the first seconds after a big release, prices can jump around before the market has fully read the report, and spreads can widen a lot. Our post on why spreads widen on news explains that part. A spike like this often runs through the stop-loss orders resting just above and just below the price. Traders call that a liquidity sweep: price grabs the orders on one side, then the other, and only then picks a direction.
The next hour: the real direction
After the spike, gold settled between roughly $4,044 and $4,055 for about half an hour. It never got back to the pre-release price of $4,062: the highest point after the release candle was $4,054.57, in the 13:35 candle. That told traders the strong report was winning.
From 14:05 GMT the second leg started. Gold slid below the spike low of $4,032.26 in the 14:15 candle (low $4,030.80) and reached the low of the move, $4,028.59, in the 14:30 candle, which was $33.50 below the pre-release close.
The bounce
Then sellers ran out of steam. From the 14:45 candle gold climbed back, and at 15:00 GMT (10:00 am New York) it closed at $4,050.89, still $11.20 below the pre-release close but $22.30 above the low. Kitco also reported spot gold near $4,050.95, down $34.10 (0.89%) on the day in early US trading, which matches our feed.
So the pattern was: spike both ways → settle below the pre-release price → second leg lower → bounce. That is not unusual. In our study of 25 NFP releases, the release hour was typically far wider than an ordinary hour, and the first move was not always the final one.
What it means for the December Fed meeting
The Fed’s next decision is on Wednesday 9 December 2026 (the meeting runs 8–9 December). Here is what we know, and what we do not:
- Before the report, interest rate futures priced about a 70% chance of a quarter-point hike in December, according to Kitco. Our December hike odds guide explains where these odds come from.
- After the report, Kitco said the data strengthened the case for another increase. We have not found a verified post-report probability at the time of writing, so we do not quote one. You can check the live figure on CME FedWatch; our guide on how to read CME FedWatch shows how.
- Two big reports still come first: October CPI inflation on Tuesday 10 November and the November jobs report on Friday 4 December, both at 8:30 am New York (13:30 GMT). A weak CPI or a weak December jobs number could still change the picture.
In plain words: one strong jobs report makes a hike more likely, but it does not decide it. The Fed has said the data will guide it, so every big release from now to 9 December can move gold.
How careful traders handle the first minutes
This is not a signal and not a trade plan. It is how many experienced traders approach a release like this one, and Friday showed why.
- Stay out of the release candle. The 13:30 candle went $17 up and $30 down in five minutes. A stop placed $10 or $15 away would have been hit on either side. Spreads also widen most in those first seconds. Our NFP day guide covers this.
- Wait for the first candles to close. Many traders wait for at least the first 15-minute candle to finish. On Friday, the 13:30–13:45 period closed at $4,044.86, below the pre-release price and in the lower half of the spike. That close said more than the spike did.
- Use the spike as a map. The spike high ($4,079.25) and spike low ($4,032.26) became the key levels for the rest of the morning. A trader with a plan decides in advance what a break, or a return inside the range, would mean.
- Size from the stop, not from hope. News ranges are wide. If the stop has to be wider, the position has to be smaller. Use the position size calculator before the release, not after.
- Respect the bounce. After the low at $4,028.59, gold recovered $22 in half an hour. Moves after news often come in waves, so plan where you take profit instead of hoping the first leg runs forever.
After a surprise this large, the next few sessions can stay jumpy, especially into CPI on 10 November. Slippage can happen on stops during fast moves; see our slippage guide. Leveraged gold trading can lose money quickly.
Three lessons from today
- The first move lied. Gold went up before it went down. Anyone who chased the first spike was trapped within seconds.
- The full report mattered, not just the headline. The beat on jobs, the drop in unemployment, the 0.4% pay rise and the upward revisions all pointed the same way, which is why the move held.
- Rates are the bridge. Jobs moved Fed expectations, Fed expectations moved yields and the dollar, and that moved gold. Watching the 2-year yield next to XAUUSD makes news days easier to read.
Trade the next release together
Big releases are easier with other traders reading the same numbers and charts. In the XAUUSD Global community, members share their plan before releases like CPI, talk through the reaction live, and review it afterwards. No one promises profits, and everyone brings their own levels. The community is free during early access. If paid plans ever come, members will be told first and nothing is charged automatically. Join with free early access.
Sources
- US Bureau of Labor Statistics: The Employment Situation, October 2026 (released 6 November 2026)
- Kitco: Gold falls as U.S. payrolls surge by 165,000, strengthening December Fed hike case, 6 November 2026 (2-year yield, firmer dollar, about 70% December hike odds before the report, spot gold in early US trading)
- CME Group: FedWatch tool
- Gold prices: 5-minute spot XAUUSD candles from the XAUUSD Global live feed, 13:20–15:00 GMT on 6 November 2026; changes and ranges are our own calculations
- Forecast range: our NFP preview and the 6 November daily digest
Educational content only, not financial advice. Trading gold with leverage carries a high risk of loss.
Frequently asked questions
What did the October 2026 jobs report show?
According to the Bureau of Labor Statistics release on 6 November 2026, nonfarm payrolls rose by 165,000 in October. The unemployment rate fell to 4.1% from 4.2%. Average hourly earnings rose 14 cents, or 0.4%, to $38.00, and were up 3.1% over 12 months. The average workweek was 34.4 hours, and August and September together were revised up by 84,000 jobs.
What was expected for October payrolls?
About 65,000. Our 6 November digest listed forecasts of 59,000 to 65,000, and Kitco reported a forecast of about 65,000. So the actual number was roughly 100,000 jobs above what the market expected, and the upward revisions added to the surprise.
How did gold react to the jobs report?
It ran both ways and then fell. In our live spot feed, gold was at $4,062.09 just before 13:30 GMT (8:30 am New York). In the 13:30 five-minute candle it rose to $4,079.25, then dropped to $4,032.26, and closed that candle at $4,049.87. It kept sliding to a low of $4,028.59 in the 14:30 GMT candle, then recovered to about $4,051 by 15:00 GMT.
Why does a strong jobs report push gold down?
A strong job market gives the Federal Reserve more room to keep rates high or raise them. That tends to lift Treasury yields and the dollar. Gold pays no interest, so higher yields make holding it less attractive, and a stronger dollar makes it more expensive for buyers using other currencies. Kitco reported that the 2-year Treasury yield rose about 6 basis points to 4.53% after the release, with a firmer dollar.
Does this mean the Fed will hike in December?
Nobody knows yet. Before the report, interest rate futures priced about a 70% chance of a quarter-point hike at the 8–9 December meeting, Kitco reported, and the strong report strengthened that case. The October CPI report on 10 November and the November jobs report on 4 December still come before the decision. You can check the latest odds yourself on CME FedWatch.
Is this a signal to buy or sell gold?
No. This post explains what happened, using official data and real prices. It does not tell anyone to buy or sell. Any trade needs your own plan, levels and risk limits, and leveraged gold trading can lose money quickly.
Comments
No comments yet.
More in Market news & outlook
- FOMC Minutes Time Today (18 Nov 2026): Time Zones, What to Read and Gold's Past Moves
- Gold Week Ahead: After the Hot CPI, Can XAUUSD Hold $4,000? (Oct 19–23, 2026)
- Gold Price Prediction 2027 (and End-2026): What the Big Banks Expect for XAUUSD
- CPI Time Today: When the US Inflation Report Lands in 25 Time Zones (10 Nov 2026)
- Why Is Gold Down in 2026? From the $5,589 Record to $4,100