Liquidity Sweep, MSS and FVG on Gold, Step by Step
The smart-money sequence on a real gold chart from 21-22 October 2026: higher time frame bias, buy-side liquidity at $4,160, the sweep, the market structure shift, the fair value gap, then entry, stop and targets.
Key points
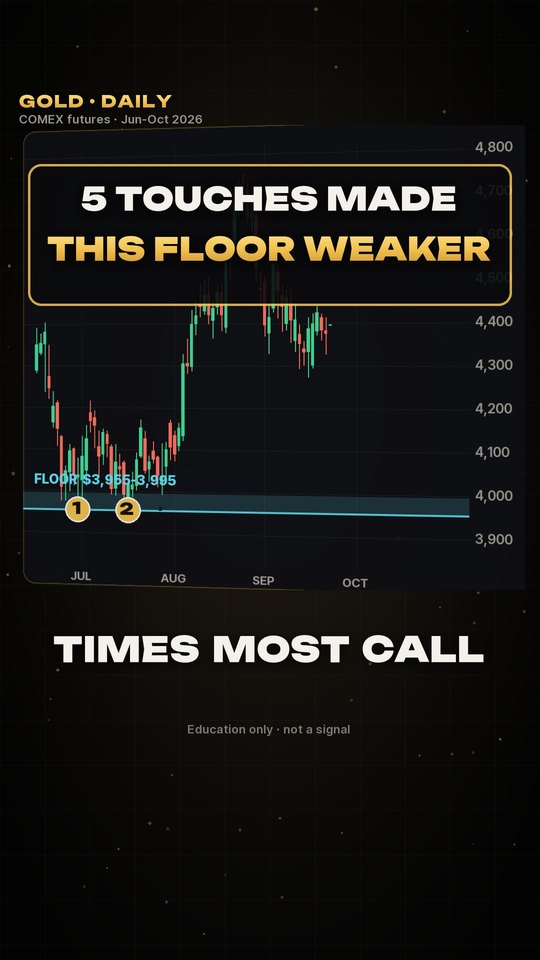
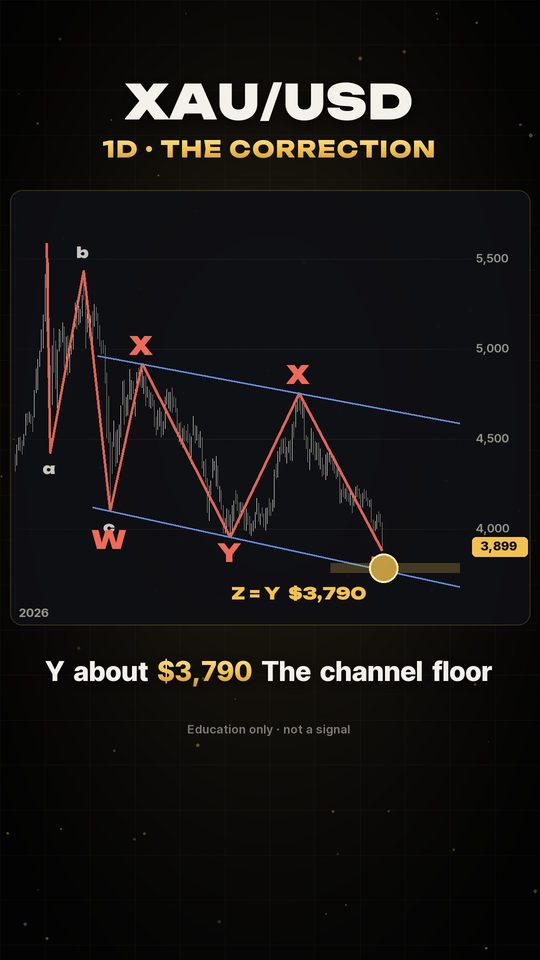
Higher time frame: daily lower highs at $5,586.2 (29 Jan), $5,434.1 (2 Mar), $4,917.7 (17 Apr) and $4,755.0 (25 Aug 2026).
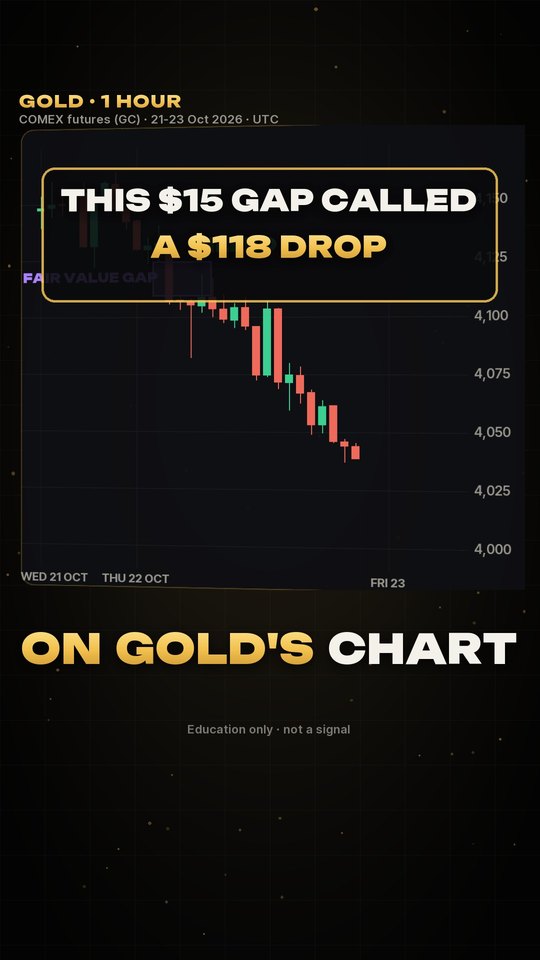
Liquidity: equal 1-hour highs at $4,160.6 (12:00 UTC) and $4,160.3 (20:00 UTC) on 21 Oct; the 22:00 candle swept to $4,164.3 and closed back at $4,147.9.
Market structure shift: the 03:00 candle on 22 Oct broke the $4,122.3 swing low, reaching $4,105.8 and leaving a fair value gap from $4,109.3 to $4,124.7.
Entry inside the gap at $4,117 with a stop at $4,127 risks $10; the last low at $4,082.4 is 3.5R and the 23 Oct low of $4,000.9 is about 11.6R.
A past example for education, not a signal. Not every sweep leads to a shift, which is why the stop sits above the gap.
Chart data: COMEX gold futures daily and 1-hour OHLC (UTC), 21-23 Oct 2026. Education only, not a signal.
Read more: Liquidity Sweeps on XAUUSD: How Gold Stop Runs Work · Fair Value Gaps (FVG) on XAUUSD: A Practical Guide · Smart Money Concepts (SMC) for XAUUSD: A Balanced Guide
Transcript
Big money leaves footprints. Here's how to read them.
Daily chart first. Gold keeps making lower highs, so the bias is down.
On the one-hour, two equal highs at $4,160. Stop losses stacked above.
Price spikes above, and fails. Stops taken. Liquidity sweep. Then it breaks the last swing low. Market structure shift.
The drop left a gap, a fair value gap. Wait for price to come back. It does. Entry at $4,117.
Stop above the gap. Ten dollars of risk. Target one, the last low. Three and a half to one. Then it kept falling, to $4,001.
Bias. Sweep. Shift. Gap. Entry. Rewatch the sweep. That's where the stops were.