5 Touches Made Gold's Floor Weaker, Not Stronger
Most traders treat a level that held several times as stronger. Gold's floor near $3,960 shows the opposite: each bounce used up buy orders, stops piled up below, and the last bounce before the break was the weakest.
Key points
Floor zone $3,955-3,995 (COMEX daily lows): 30 Jun $3,955.4, 17 Jul $3,963.0, 29 Jul $3,993.8, 23 Oct $3,989.1.
Bounces: +$260 to $4,215.5 (6 Jul), +$208 to $4,171.4 (22 Jul), a run to $4,755 (25 Aug), then only +$108 to $4,097.2 (28 Oct).
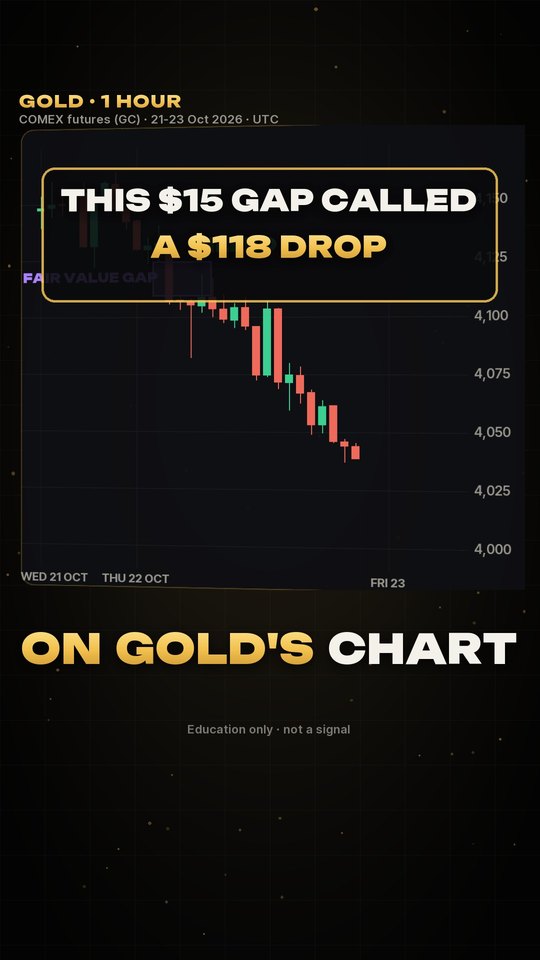
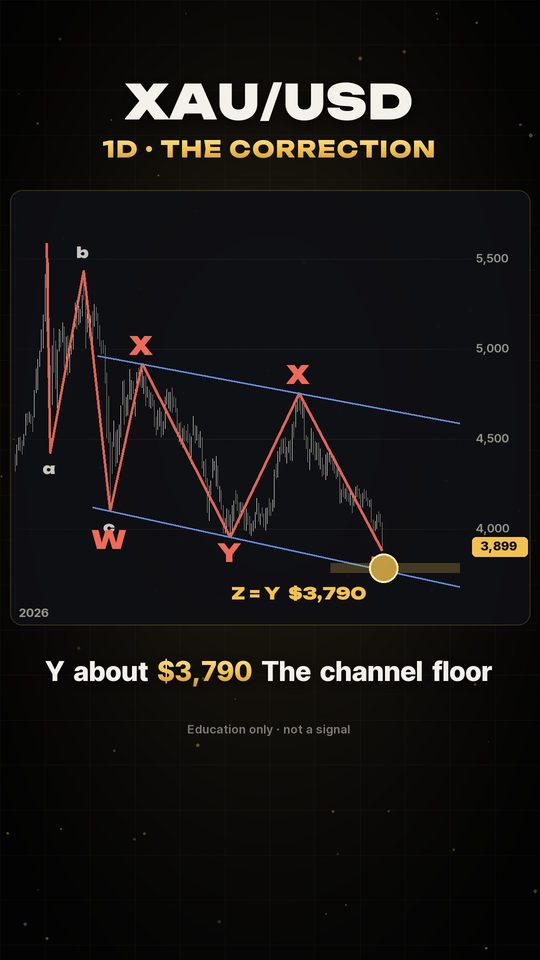
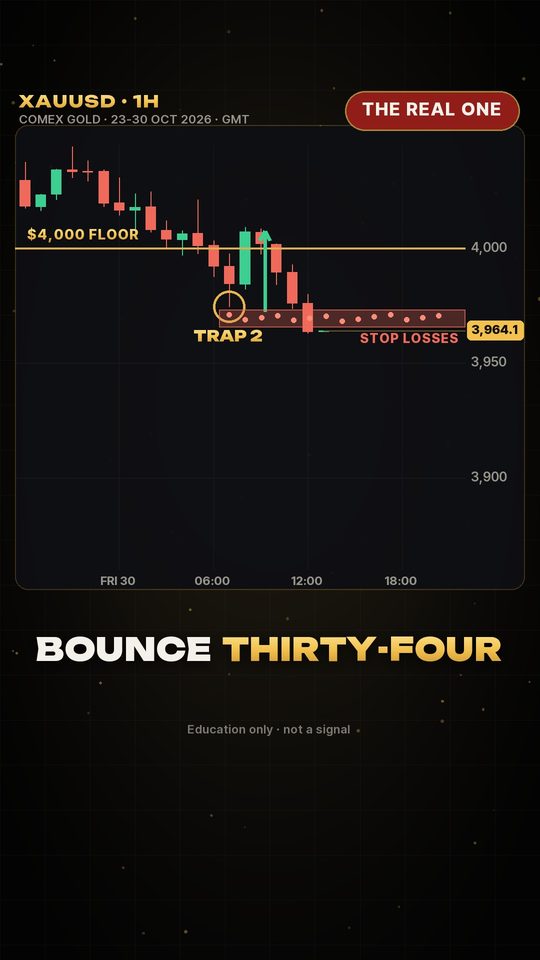
30 Oct 2026: no bounce; gold broke to $3,879.3 and closed at $3,898.9, the lowest in about a year.
Support is resting buy orders: each test absorbs some of them, while stop losses gather just below the level.
Watch the size and speed of each bounce rather than counting touches.
Chart data: COMEX gold futures daily OHLC, 15 Jun - 30 Oct 2026. Education only, not a signal.
Read more: Gold Support and Resistance Strategy: Trading XAUUSD Levels · How to Identify Support and Resistance on a Gold Chart · Why Gold Support Levels Fail: False Breaks vs Real Breakdowns at Round Numbers
Transcript
Gold hit the same floor five times. Most call that strong support. It was the opposite.
Support isn't a wall. It's a pile of buy orders, and every bounce spends some of them. Meanwhile, every touch adds more stop losses just below the floor.
Here's that floor on gold's daily chart. Touch one, late June: a $260 bounce. Touch two, mid July: $208. Touch three: one last big run, to $4,755.
Touch four, October twenty-third: just $108. The weakest yet.
Touch five: no bounce. Straight through, to $3,879, a one-year low. All those stops turned into sell orders. Fuel for the drop.
So read the reaction, not the count. Smaller bounces mean the floor is getting thin.
How many touches before you stop trusting a level? Comment a number.