Gold Has Never Done This: 2008 or 2013?
September and October 2026 were the first back-to-back monthly drops of more than 6% in gold since our data starts in August 2000. History offers two very different templates for what came next.
Key points
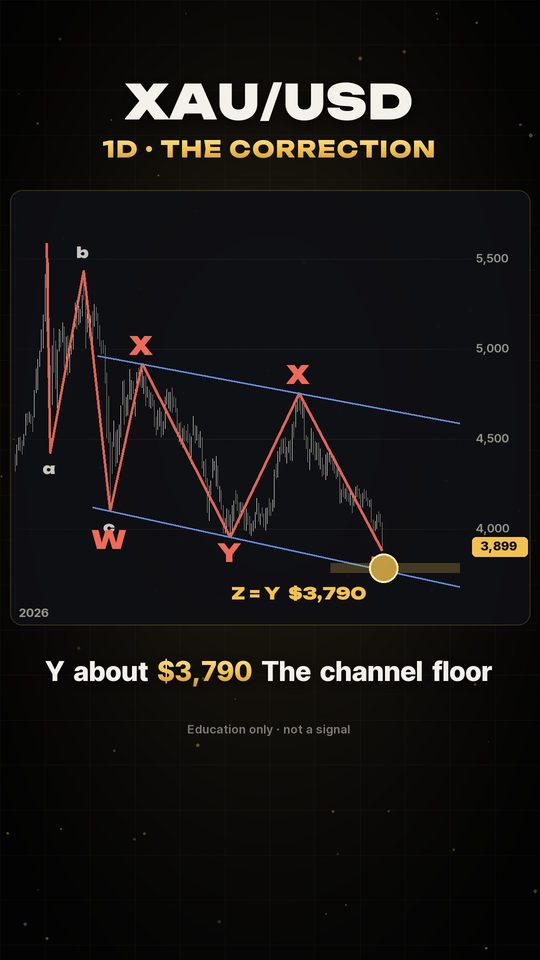
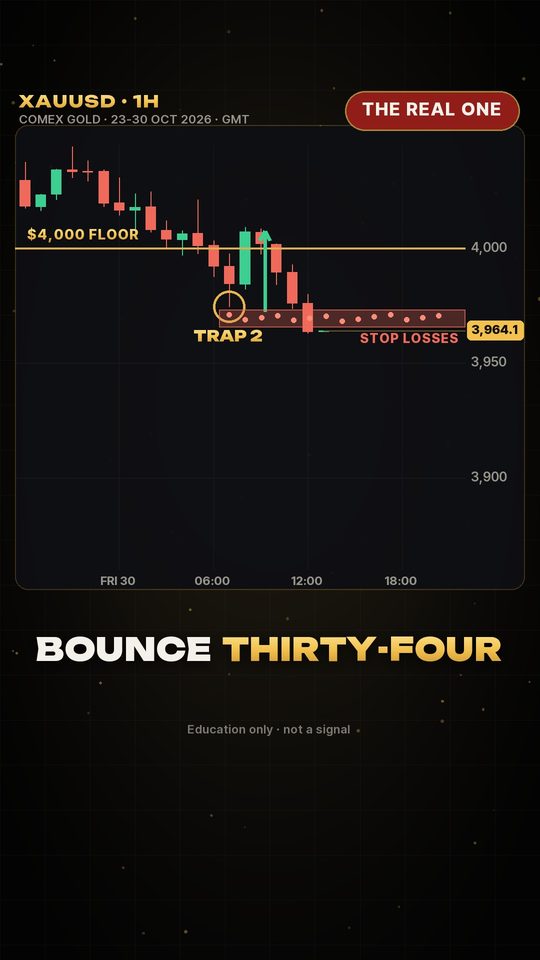
September 2026: -6.6%. October 2026: -6.9%. From the 31 Aug close ($4,481.5) to the 30 Oct close ($3,898.9): -13.0%.
Gold closed October about 30% below the 29 Jan 2026 record high of $5,586.2.
After October 2008 (-18.0%) gold was 29.4% higher three months later ($716.8 to $927.3).
After April 2013 (-7.7%) the fall continued: by 31 Dec 2013 gold was 24.6% below its end-of-March price.
Of 17 months with a 6%+ drop (Aug 2000 - Aug 2026), 12 were higher three months later and 5 were lower. History is not a promise.
Chart data: COMEX gold monthly closes, Aug 2000 - Oct 2026 (site data). Education only, not a signal.
Read more: Gold in October 2026: −6.9% Month in Review · Gold price history
Transcript
Gold just did something it has never done. Not in 2008. Not in 2013.
Two months in a row, both down more than six percent. First time in twenty-six years.
Thirteen percent gone in sixty days. Thirty percent off January's record.
So what happens next? History gives us only two answers.
Answer one: 2008. October crashed eighteen percent. Three months later? Up twenty-nine.
Answer two: 2013. April cracked. June cracked harder. By December, down twenty-five percent.
Here's what nobody shows you. Seventeen times, gold fell over six percent in a month. Twelve times, it was higher three months later. Five times, it wasn't.
So which one is this: 2008, or 2013? Comment your answer.