The $4,000 Gold Floor That Fooled Traders Twice
A support level that held all week, two false breaks in one morning, and the hourly candle that finally gave way. The real 1-hour COMEX candles from Friday 30 October 2026.
Key points
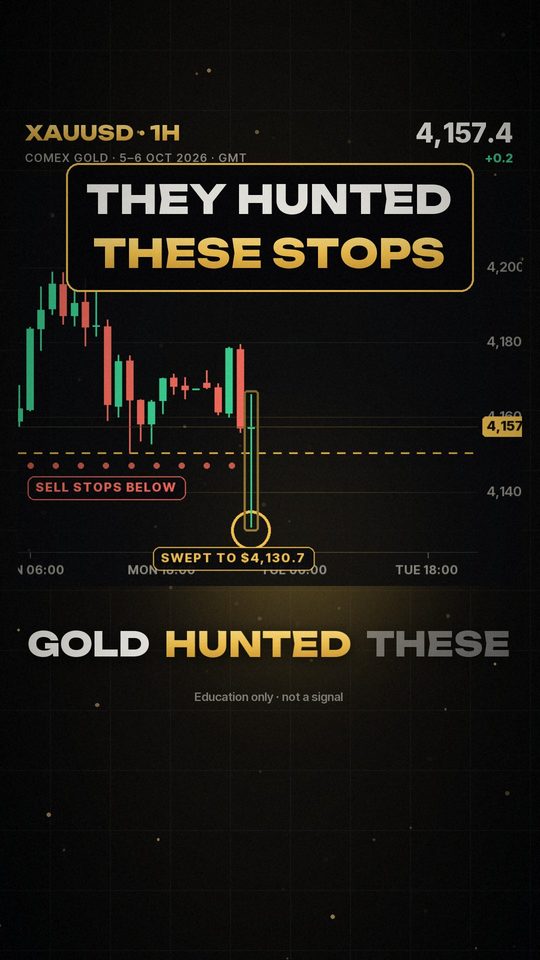
Dips under $4,000 on 23 and 26 Oct were bought back the same day (lows $3,989.1 and $3,990.9).
Trap 1, 04:00 GMT: low $3,997.0, close back above at $4,006.4.
Trap 2, 07:00-08:00 GMT: low $3,974.7, then a +$22.7 candle to a high of $4,009.2.
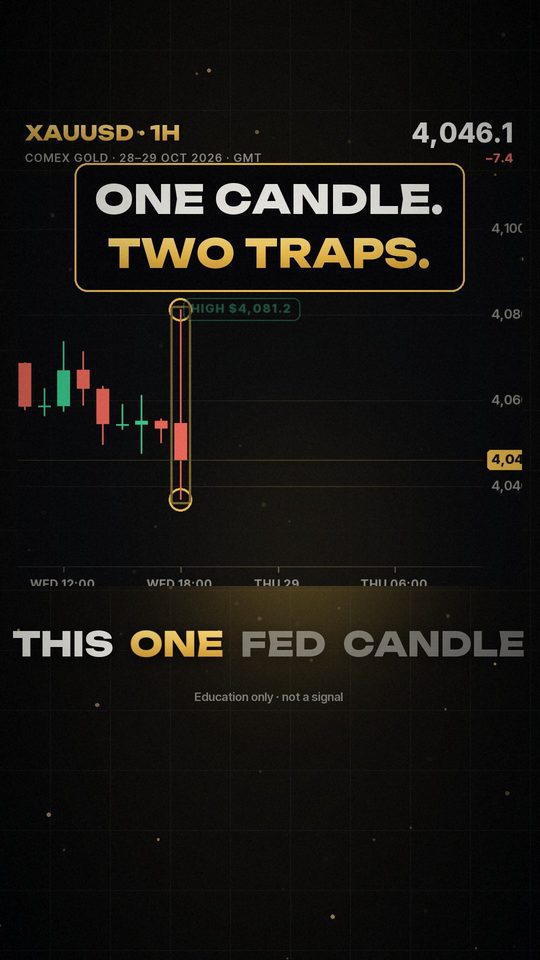
The break, 13:00 GMT: one candle from $3,963.6 to $3,929.5; the day’s low was $3,879.3, $129.9 under the trap-2 high.
Repeated tests use up the buy orders at a level: watch closes and follow-through, not wicks.
Chart data: COMEX gold futures 1-hour candles, 23-30 Oct 2026, GMT. Education only, not a signal.
Read more: 2026 10 31 · Gold Support and Resistance Strategy: Trading XAUUSD Levels · How to Identify Support and Resistance on a Gold Chart
Transcript
This gold floor fooled traders twice. The third time? No bounce.
All week, every dip under $4,000 got bought.
Friday morning, gold slips under $4,000 again, and snaps right back. Trap one.
Three hours later, a deeper stab to $3,975. Then a monster green candle back to $4,009. Now everyone believes the floor. Trap two.
But look where their stop losses were sitting.
Hours later, no bounce. Thirty-four dollars in one candle. The stops fire, and the selling feeds itself.
By the end of Friday, $3,879. A hundred and thirty dollars below the trap high.
The lesson: a floor that needs saving twice is getting weaker, not stronger.
So on Monday, is $3,900 the new floor, or the next trap? Comment floor, or trap.